We’ve been saying he for a while now that the housing market is not in the dire straits many would say it is. Now, we are also not saying “everything is great” and calling for an unbridled housing bull market. Far from it. What we are saying is that there are many signs of stability and even, dare we say, improvement. We also do not buy into the “housing has another 20% to fall scenario”.
For that reason our portfolio has gradually taken on a “housing recovery” aspect to it. Now, this is not a broad based shot gun approach but we have concentrated investments in certain areas and with certain companies we feel will benefit even from a modest improvement in their locals.
We believe the “shadow inventory” used by people to foretell the next leg down will not cause that event. Rather, we feel it will cause the housing recovery to be more muted than it would ordinarlily be as these homes are steadily trickled, not dumped, onto the market. This is ok. If you are making investments in the sector at wonderful prices and get even a muted recovery, you can profit handsomely.
Last week we stumbled across two pieces of information that seemed to back our perspective. We focus on them because it is rare to find them….
Citi’s Josh Levin said last week:
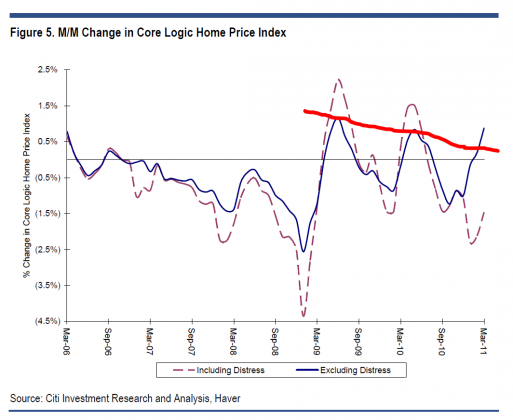
Contrary to the headlines, more timely data indicates that home prices are actually going up on a m/m basis and have been doing so since February. Such home price data comes from less well-known data sources such as Radar Logic and Altos. To be sure, such price improvements are largely if not exclusively due to seasonal factors and will likely fade in the fall.
However, we think this recent price strength has both near-term and long-term positive implications for home prices and stocks which are sensitive to home prices.
Further:
Even if the seasonal price strength fades in the autumn, we believe it nonetheless suggests that home prices are likely to soften modestly from here and not fall another 10% to 20% as some bears are predicting. ’08 was the last spring selling season that took place without the aid of the homebuyer tax credit, so it is a better comp for the ’11 selling season than ’09 and ’10 since these two selling seasons enjoyed the benefit of a tax credit. We observe that in the spring of ’08, home prices did not turn positive on a m/m basis (as has already happened this year) and continued to fall throughout the year. The fact that home prices are increasing and not decreasing in the first spring selling season in three years not to be aided by a homebuyer tax credit, and that distress sales as a percentage of total sales are close to an all-time high, suggests to us that home prices will not drop precipitously. Our best guess is a decline of ~5% or less.
We have seen this first hand with our Howard Hughes ($HHC) holding. The company recently reported lot sales at higher levels than 2010.
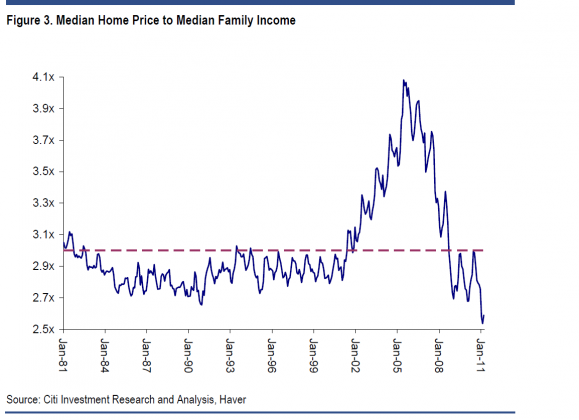
As for affordability, home prices are at multi-decade lows…
From CNBC:
From the video:
It looks like the indices are dropping when in fact what’s happening is simply housing prices are stable in the non-distressed sector, but somewhat down in the distressed sector….
From “Davidson”
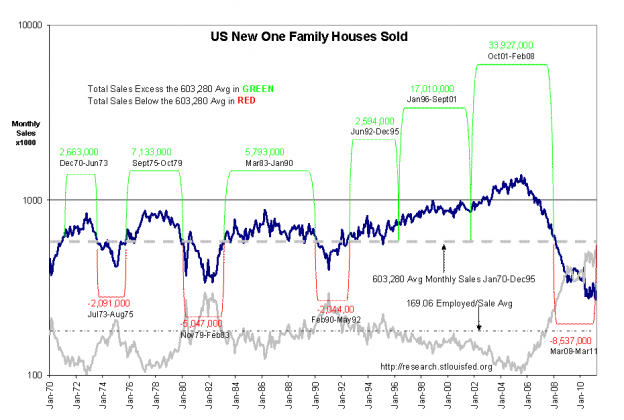
There remains considerable consternation over the pace of housing starts and new single family home sales with some speculating that it will be years yet before a housing recovery could occur. To this end I created the chart below using St Louis Fed data on US New One Family Houses Sold on a monthly basis and compared this to the Household Survey-Employment (HES) data which is deemed to capture the US employment situation better (HES captures established companies as well as the self-employed) than that provided by the Establishment Survey. The numbers and periods of homes built and sold in excess of average are identified with GREEN brackets while those numbers and periods of homes built and sold below average are in RED. The average monthly rate of 603,028 thru 1995 is shown in the GRAY DASHED LINE. (1970-1995 is used for determining the average- the Community Reinvestment Act of 1995 distorted data after 1995) NOTE: The pace of new home sales appears to be linear. At first glance the numbers of homes built and sold in excess during Jan 1996 to-Feb 2008 is in the range of 50,000,000, i.e. 50 million homes built in excess!!
But, this view is tempered when one compares the rate of US New One Family Houses Sold to the population using the Household Survey which is shown in the bottom of the chart as a SOLID GRAY LINE with an average determined with data from1970-1995 of 169.06 Employed per New House Sold (BLACK DASHED LINE). Although the chart’s vertical scale is logarithmic, the relationship between the pace of US New One Family Houses Sold and the population appears to be linear, i.e. new home creation follows population growth in the ratio of ~170 Employed Individuals per New House Sold.
The February 2011 pace of new home sales reached a record 516 Employed Individuals per New House Sold. There are today many more individuals employed vs. the numbers of new homes sold! This is a period of considerable financial uncertainty, but probably not more than that seen in earlier periods although measuring this aspect of home buying is virtually impossible in my opinion. While this analysis could be missing something not yet revealed, nonetheless there appears to be much more than sufficient capacity to buy new homes, but that pace has dropped perhaps in conjunction with recent events to lows not seen in this data going back to 1963. We are at truly historical lows regarding the pace of new home sales.
Younger entrants to ranks of the employed have not lost a desire to individual privacy which is another crucial need in society which can only be fully had in one’s own home. One can only live with parents for so long! There is enormous pent-up demand for housing which should provide support for additional economic expansion in the coming years.
Individual home building companies have recently reported surges in areas not greatly affected by over-building and foreclosures. This is the first sign of recovery in my investment opinion. I expect new home sales to gradually recover from the Feb11 record low pace in the next 12mos as foreclosures are worked out of the system. Shelter (and privacy), like food, medical care and transportation, is a fundamental need of society. I expect housing to recover and supply considerable support to the existing economic expansion.


