Note: This is part of a much larger study being done on the subject
“Davidson” submits:
The context for the correlation of stock prices and book value per share comes from an examination of shareholder returns. The most prevalent view of modern finance is that investor returns come from increases in net cash which are generated over the course of business activity. This is expressed in general terms as a Return on Equity (ROE) defined as Net Income/Shareholder Equity or as a Return on Invested Capital (ROIC) defined as Net Income/Invested Capital. Various short-hand screens have evolved with the advent of computers that focus on single parameters the most common of which are Earnings per Share (EPS), Cash Flow (CF) or Free Cash Flow (FCF).
This study follows a different approach. Shareholder returns as used in this paper are viewed as adds to the value of the business (Retained Earnings), paid out as cash (Dividend) or some of each. No other uses of Net Income benefits shareholders. Shareholders do not receive Net Income or Cash Flow directly, only through the corporate managements’ decisions that relates to dividends and retained earnings. Viewed in this context, the growth in the price of common stock should be correlated to the rate of growth of its Dividends and Shareholder Equity/Share or Book Value/Share. Observation of numerous individual companies prior to this study indicated that in many instances there existed a strong correlation. The examination of the stocks comprising the SP500 were undertaken to identify the extent of the correlation.
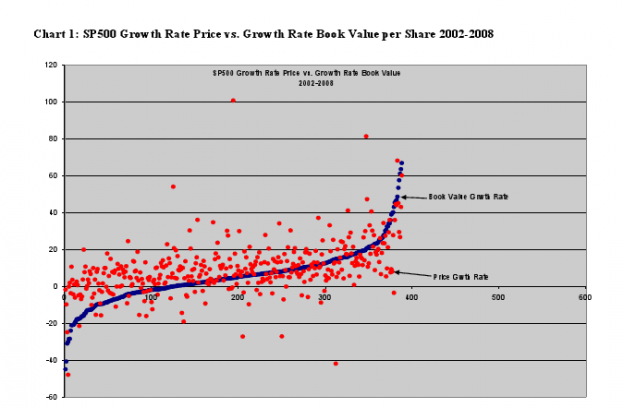
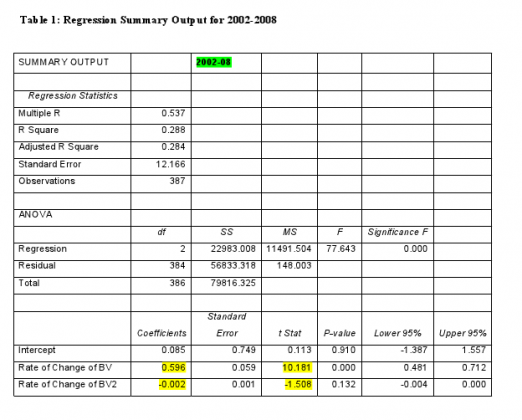
The study was performed over two periods 2001-2010 and 2002-2008. The 2001-2010 period reflected the fact that the study had available 10yr data from Morningstar. The 2002-2008 period was selected based on the fact that the period end points reflected market lows during which it was believed that market prices were predominately dominated by long term value investors who in the investment literature had indicated they used book value as a significant factor in their investment decisions. The study had three goals 1) to illustrate whether or not there was a relationship between book value per share and price, 2) to establish the strength of the relationship and 3) to determine to what extent the correlation was reflected in individual members of the SP500. The study discovered that the SP500 demonstrated a strong correlation between Price and Book Value, but the relationship was seen to have additional determining factors when individual companies were examined.
Some companies were excluded because their SP500 membership did not span the period while others had negative end of period book values which could not used in calculation. As a result, the study involved 388 companies of the SP500. If a company had changed its fiscal year end during the period, i.e. fiscal year end changing from March 2002 to December 2008, the appropriate book values per share and month end prices were.
Table 1: Regression Summary Output for 2002-2008
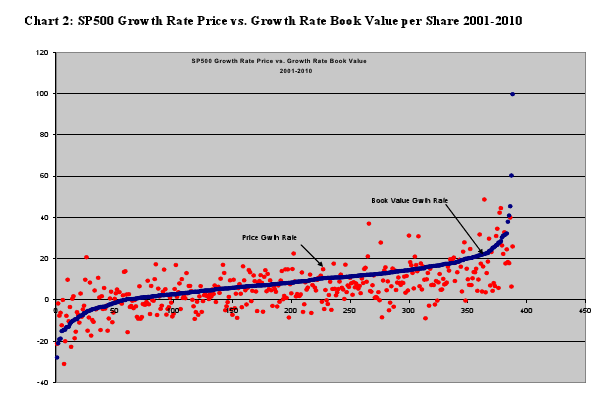
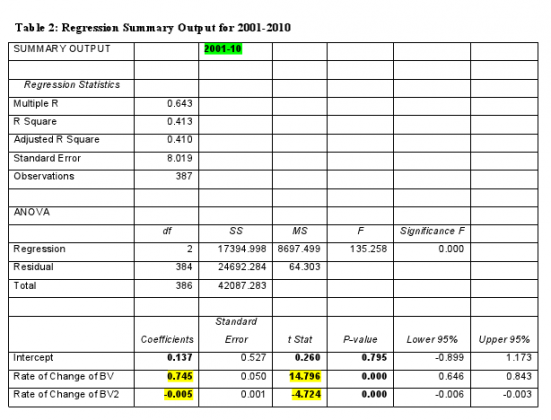
The 2001-2010 study is shown in Chart 2: SP500 Growth Rate Price vs. Growth Rate Book Value per Share 2001-2010. The regression analysis can be seen in Table 2: Summary Output for 2001-2010. In comparison with the 2002-2008 findings, the 2001-2010 period produced a significantly lower P-Value, which indicated a weaker correlation. The lower P-Value in the 2001-2010 period hints that additional factors are likely coming into play to influence market prices once stock prices have risen somewhat above the market lows. As noted earlier, market lows attract the long value oriented investors who by their own words focus on book value and the returns that they expect to receive from that book value during better economic periods. Basically the influx of value buyers cause prices to rise ahead of BV growth.
Look at what $NFLX did the past few years:
It is not Netflix’s fault that investors priced its shares for perfection. But the Internet video company is to blame for managing its own balance sheet for the same flawless performance.
The former high-flier announced Monday night it had sold $200 million in new shares at $70 each and another $200 million in bonds convertible to stock at $85.80. Just months ago, the stock traded above $300. It is now at $72.
Netflix could easily have avoided this. The company has spent over $1 billion on share repurchases since 2007, leaving it with just $366 million in cash and $200 million in debt at the end of the third quarter. During that time, executives including chief executive Reed Hastings have been selling shares.
In buying back shares, Netflix failed to build a cash cushion against any slowdown in its heady growth rate. With expectations for healthy subscriber additions stretching into the future, the company locked into big contracts for streaming content. Since the start of 2011, the company has more than tripled such commitments to a whopping $3.5 billion, of which $2.9 billion is due in the next three years.
$NFLX was paying $222/share in the past year as it bough back almost $200M in stock. In doing so it depleted cash balances and took 900k shares from the open market. Now, to replace that cash, they will issue 2.8M shares (this does not include the convertible dilution assuming the stock ever sees a level it can be converted at) at $70….stunning. Mangle the balance sheet, mangle the stock price.


One reply on “Book Value Growth & Share Price Growth: The Correlation”
[…] Don’t ignore the growth in book value per share as an indicator. (ValuePlays) […]