Davidson” submits:
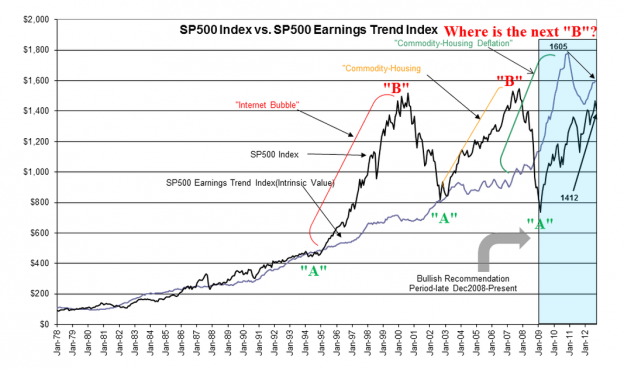
I have updated the chart of the S&P 500 vs. S&P 500 Earnings Trend Index using October month end values. The S&P 500 Earnings Trend Index has reflected the level of the S&P 500 where investors have found the most value and therefore it has been the level at which the S&P 500 has “bottomed”. Today the S&P 500 Earnings Trend Index resides at $1605 due to the gradual rising of the S&P 500 Earnings Trend Line which is $77.35 at the end of October. The S&P 500 ($SPY) shifted lower to end October at 1412 and today stands at $1395 with some investors showing displeasure at the electron results. 1395 is 15% away from 1605! Historically this spread is cheap!
We should remember the past 4yrs and the many issues with which the markets had to deal. It was very, very messy not only globally but domestically and yet the economy has grown and the S&P 500 has risen to 1395 from the March 2009 low ~667 or ~109%. There were some dramatic disagreements between the business community and politicians and even more between the two political parties and not once has the general direction of our recovery stalled even with 100s of calls by pundits for either some economic correction or outright recession. None of these calls, some by famous individuals, ever came to fruition.
If one takes the time to become familiar with our history which includes a slop bucket of politics, wars, business successes and failures, major frauds, significant legal rulings, government regulations and socio-engineering initiatives, accounting and market rule changes and even the occasional natural disaster, after a while you begin to see the resiliency of humanity which has continued sometimes slower than faster. At all times the direction has always be forward even if we did not think so at the time! I again recommend The Ultimate Resource 2 by Julian Lincoln Simon (Jul 1, 1998).
The S&P 500 Earnings Trend Index shows at what level value investors find (and have found) value in the market the past 34yrs. They buy the earnings of companies several years into the future. They do so by being sensitive to the long term earnings trend and purchase stocks when the prices represent an attractive rate of return within the context of the existing economy. This context is the “Prevailing Rate” which stands at 4.82% today. This rate is the long term Real GDP trend + 12mo Trimmed Mean PCE inflation measure. The Prevailing Rate was identified by Knut Wicksell as the “Natural Rate” of an economy in 1898. It is a simple concept, but we have not had the data to readily measure it till more recently. It is very useful in my opinion and I use the concept to create the S&P 500 Earnings Trend Index in the chart below.
By this measure the S&P 500 provides an especially good economic rate of return at any level below 1605.
