“Davidson” submits:
The arguments continue to fly for or against Government Spending as being helpful or harmful longer term. The recent data reveal that it has likely ineffective and not overly harmful to recovery.
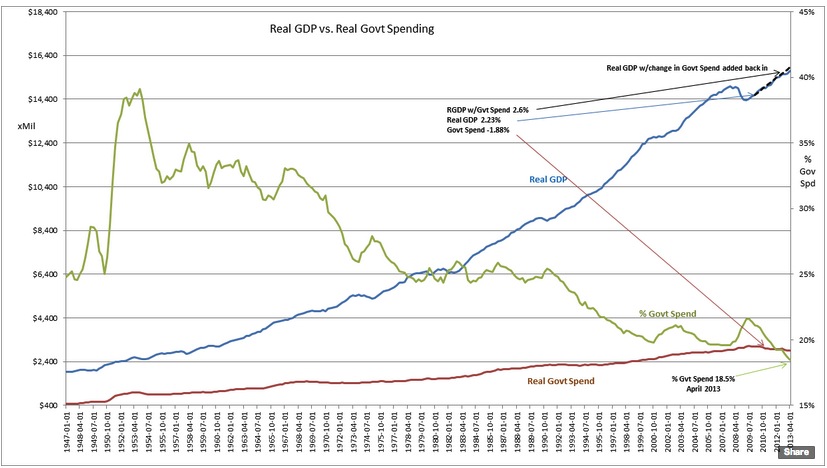
The most recent report on US Real GDP(Real GDP is our GDP corrected for inflation) reflects ~2.23% Real GDP(SOLID BLUE LINE) trend. Many selectively focus on data or even single data points and forecast futures wrought with dire outcomes. The total picture by my observations is much more positive.
The actual recovery trend as shown in the chart comes from 2 components, the private sector and the government sector. The Government sector is measured as Government Spending(SOLID RUST COLORED LINE). Surprise, surprise!! Government Spending has been declining -1.88% since spending peaked April 2009 while Real GDP has been rising about 2.23%. If we correct for falling Government Spending, our corrected Real GDP would have grown at a 2.6% pace(DOTTED BLACK LINE). A good recovery in Residential Housing and Commercial Construction will in all likelihood bring us back not only to the historical pace of 3% but to 4% Real GDP pace which has been our historical peak.
As a % of Real GDP(SOLID OLIVE GREEN LINE), Government Spending is at its lowest in recorded history. The current trends are likely to push this level considerably lower in the next several years. Part of the reason for this decline is certainly the repayment of TARP which was an expenditure in 2008-2009 but becomes income as it has been paid back.
It is also clear that total Real Govt Spending DECLINED as the Real GDP ROSE!. It does not appear that Government Spending actually had much to offer in stimulating our economy even though the headlines would have us believe otherwise.
In my experience politicians argue loudly that they have always been responsible for getting our economy out of situations that they should be allowed to dictate where tax monies should be spent. However, if one reviews our financial and political history it has always been political policies which have created financial collapses in the first instance. “The Great Depression-1929-1939”, “The Great Inflation-1965-1982” and more recently “The Great Recession-2007-2009” were each the result of politically idealist driven government programs to eliminate impoverishment. None of these efforts were successful! These financial collapses were the result of politicians believing that they could drive the “Free Markets” towards politically desired ends. “Free Markets” and politically desired outcomes are incompatible, like oil and water. Our financial history also reveals that recoveries have always come from hard working individuals operating in a “Free Market”. Recoveries emerged in spite of the misguided effort of politicians.
1) “Free Markets” and politically desired outcomes are like oil and water.
2) “Free Markets” and constitutional protections to property rights are effectively identical.
There is much to like in our economy and what I see ahead!! Optimism remains warranted in my opinion. Domestic and Intl LgCap stocks appear attractive longer term