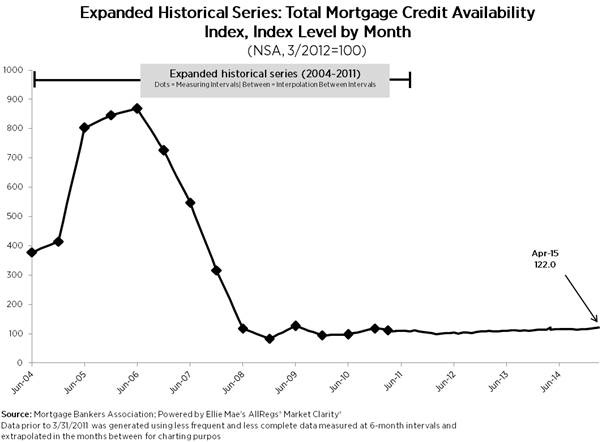
Now, before people get their panties in a bind and start yelling “bubble” or “standards are getting too loose again” please just skip to the end to see where we are today vs the actual bubble years. We are nowhere even remotely close to what we saw from ’04-’06. Not are we not even remotely close, I don’t even think one can honestly even begin to have the conversation of comparing today vs then in term of any similarities we are so far apart from those days.
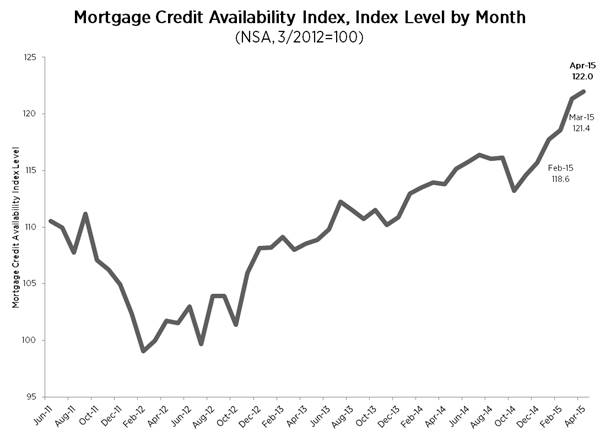
WASHINGTON, D.C. (May 12, 2015) – Mortgage credit availability increased in April according to the Mortgage Credit Availability Index (MCAI), a report from the Mortgage Bankers Association (MBA) which analyzes data from Ellie Mae’s AllRegs® Market Clarity® business information tool.
The MCAI increased 0.5 percent to 122.0 in April. A decline in the MCAI indicates that lending standards are tightening, while increases in the index are indicative of a loosening of credit. The index was benchmarked to 100 in March 2012. Of the four component indices, the Government MCAI saw the greatest easing (up 1.1 percent over the month), followed by the Jumbo MCAI (up 0.8 percent), and the Conforming MCAI (up 0.2 percent). The Conventional MCAI decreased over the month (down 0.6 percent).
“Mortgage credit availability increased on net in April,” said Mike Fratantoni, MBA’s Chief Economist. “The increase was driven by new offerings of FHA’s 203K home improvement program, new VA offerings, and new jumbo products. The increase was partially offset by some investors tightening underwriting criteria on conventional cash out offerings.”
Source: Mortgage Bankers Association; Powered by AllRegs® Market Clarity®
CONVENTIONAL, GOVERNMENT, CONFORMING, AND JUMBO MCAI COMPONENT INDICES
MBA now reports on five total measures of credit availability as part of the monthly MCAI release: the Total Mortgage Credit Availability Index, the Conventional Mortgage Credit Availability Index, the Government Mortgage Credit Availability Index, the Conforming Mortgage Credit Availability Index, and the Jumbo Mortgage Credit Availability Index, with historical data back to 2011.Of the four component indices, the Government MCAI saw the greatest easing (up 1.1 percent over the month), followed by the Jumbo MCAI (up 0.8 percent), and the Conforming MCAI (up 0.2 percent). The Conventional MCAI decreased over the month (down 0.6 percent).
EXPANDED HISTORICAL SERIES
Source: Mortgage Bankers Association; Powered by Ellie Mae’s AllRegs® Market Clarity®The Conventional, Government, Conforming, and Jumbo MCAIs are constructed using the same methodology as the Total MCAI and are designed to show relative credit risk/availability for their respective index. The primary difference between the total MCAI and the Component Indices are the population of loan programs which they examine. The Government MCAI examines FHA/VA/USDA loan programs, while the Conventional MCAI examines non-government loan programs. Similarly, the Jumbo MCAI examines everything flagged as “Jumbo” while the Conforming MCAI examines loan programs that fall under conforming loan limits.The Conforming and Jumbo indices have the same “base levels” as the Total MCAI (March 2012=100), while the Conventional and Government indices have adjusted “base levels” in March 2012. Using data from the MCAI and the Weekly Applications Survey, MBA calibrated the Conventional and Government indices to better represent where each index might fall in March 2012 (the “base period”) relative to the Total=100 benchmark.
The Total MCAI has an expanded historical series which gives perspective on credit availability going back approximately 10-years (expanded historical series does not include Conventional, Government, Conforming, or Jumbo MCAI). The expanded historical series covers 2004 through 2010, and was created to provide historical context to the current series by showing how credit availability has changed over the last 10 years – this includes the housing crisis and ensuing recession. Data prior to March 31, 2011, was generated using less frequent and less complete data measured at 6-month intervals and interpolated in the months between for charting purposes.