There are a few pieces to this. First, mortgage credit continues to improve, albeit painfully slowly. This is the reason I’ve been saying for some time now higher rates are needed. Higher rates will increase the availability of credit to other borrowers vs who is getting it now (the lowest credit risk). Demand won’t be dampened and in fact once the general public starts to think rates are actually going to start going higher, I think you’ll see a surge in demand (to lock in lower purchase rates).
Second, and most importantly. We are nowhere near a bubble. Just because prices rise, it does not mean a bubble. Bubbles are multi-variable events. For housing they need to include essentially “free money”. By “free” I don’t mean low rates. By free I mean banks are handing out mortgages to anyone. Both the recent housing bust and the housing downturn in the early 90’s featured this. The recent housing bubble included free money (liar loans, interest only etc), rising prices and rising inventories (both happened from 2004-’08). When inventory almost triples while sales fall and prices still rise significantly, that is a sign something very wrong is happening.
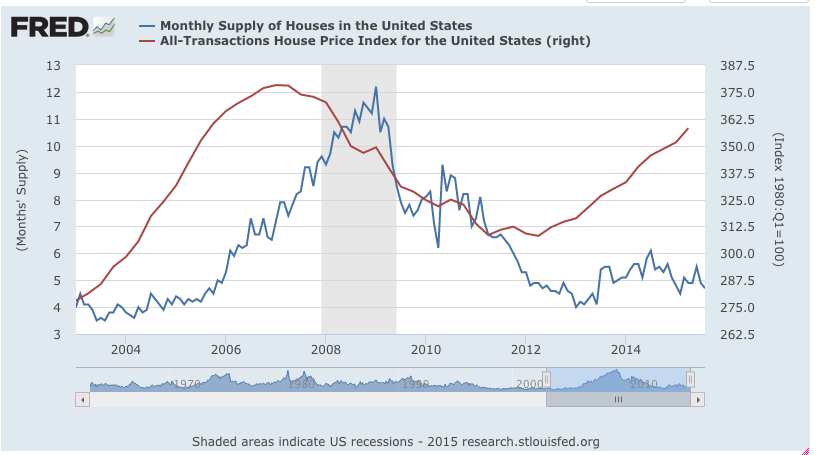
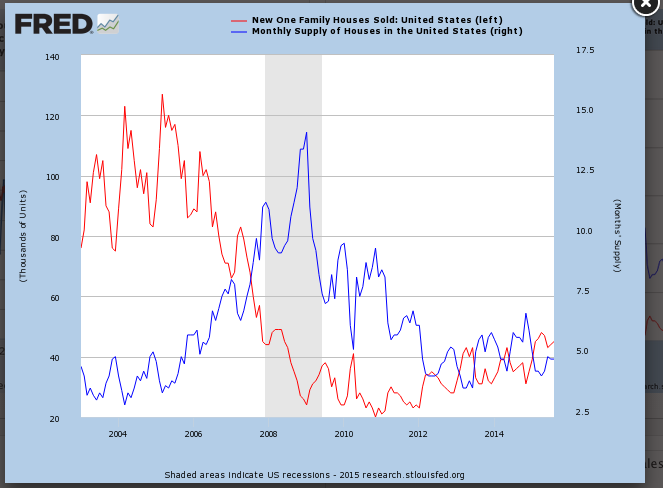
We are not even close to those days as we have none of those conditions. The only reason prices are rising the way they are is because supply is so very low and has been low for nearly 4 years now. Until housing nationally gets back to ~6mos inventory, prices will keep going up, simple.
Now, builders cranking up production so inventory reaches the 6mos level won’t crash prices. What it will do is slow down the rate of price appreciation which would be just fine as stable prices would bring more sellers into the market (vs holding out for top dollar).
Bottom line is housing is in a very stable condition poised for years of growth ahead.
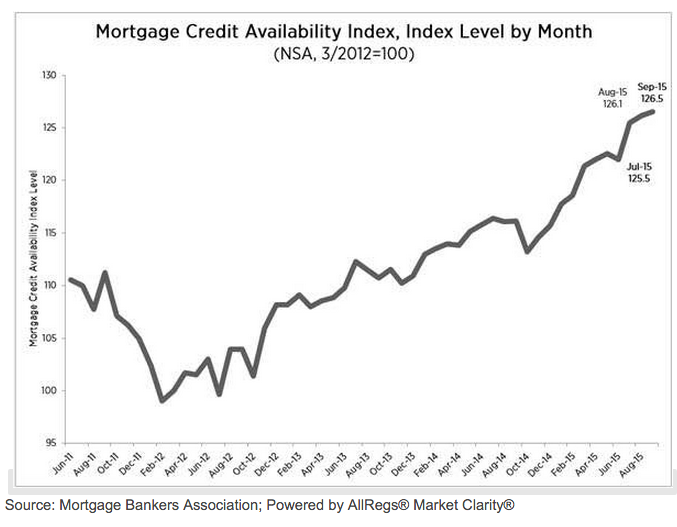
WASHINGTON, D.C. (October 6, 2015) – Mortgage credit availability increased in September according to the Mortgage Credit Availability Index (MCAI), a report from the Mortgage Bankers Association (MBA) which analyzes data from Ellie Mae’s AllRegs® Market Clarity® business information tool.
The MCAI increased 0.3 percent to 126.5 in September. A decline in the MCAI indicates that lending standards are tightening, while increases in the index are indicative of loosening credit. The index was benchmarked to 100 in March 2012. Of the four component indices, the Conventional MCAI saw the greatest loosening (up 1.1 percent over the month) followed by the Conforming MCAI (up 0.8 percent). The Jumbo MCAI was unchanged over the month and the Government MCAI decreased 0.2 percent.
“Credit availability increased slightly in September due to some expansion of conventional affordable offerings,” said Mike Fratantoni, MBA’s Chief Economist. “In particular, this month there was an increase in the offerings of Freddie Mac’s affordable lending programs.”
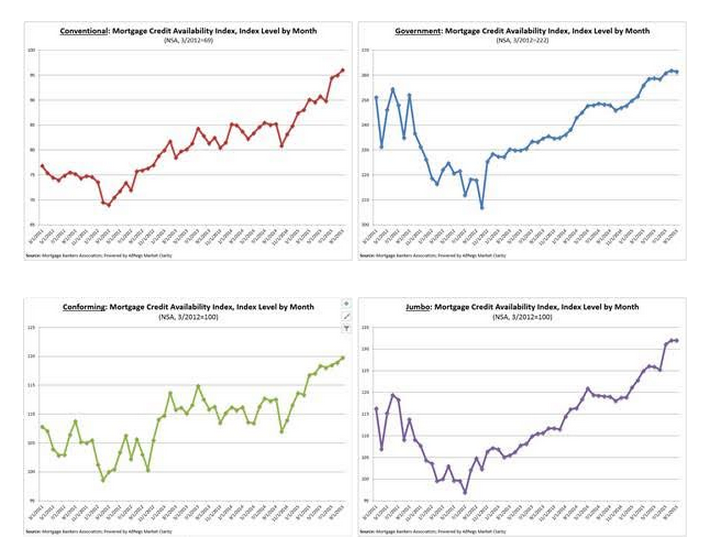
Source: Mortgage Bankers Association; Powered by AllRegs® Market Clarity®CONVENTIONAL, GOVERNMENT, CONFORMING, AND JUMBO MCAI COMPONENT INDICES
MBA now reports on five total measures of credit availability as part of the monthly MCAI release: the Total Mortgage Credit Availability Index, the Conventional Mortgage Credit Availability Index, the Government Mortgage Credit Availability Index, the Conforming Mortgage Credit Availability Index, and the Jumbo Mortgage Credit Availability Index, with historical data back to 2011.Of the four component indices, the Conventional MCAI saw the greatest loosening (up 1.1 percent over the month) followed by the Conforming MCAI (up 0.8 percent). The Jumbo MCAI was unchanged over the month and the Government MCAI decreased 0.2 percent.
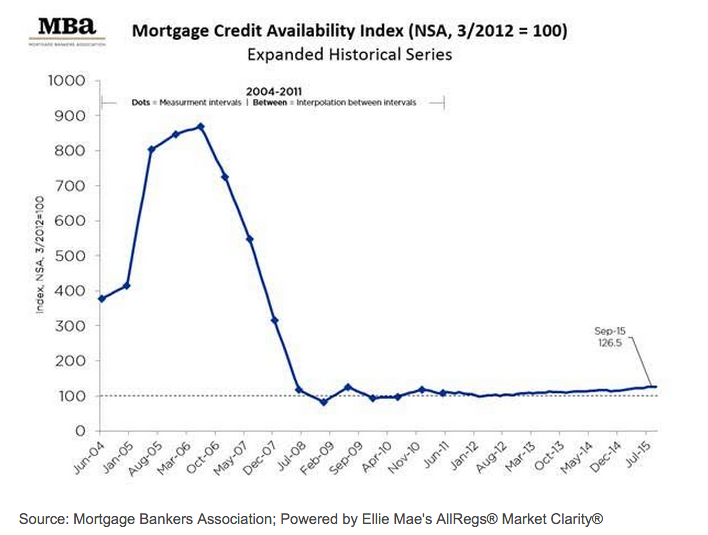
EXPANDED HISTORICAL SERIES
Source: Mortgage Bankers Association; Powered by Ellie Mae’s AllRegs® Market Clarity®The Conventional, Government, Conforming, and Jumbo MCAIs are constructed using the same methodology as the Total MCAI and are designed to show relative credit risk/availability for their respective index. The primary difference between the total MCAI and the Component Indices are the population of loan programs which they examine. The Government MCAI examines FHA/VA/USDA loan programs, while the Conventional MCAI examines non-government loan programs. Similarly, the Jumbo MCAI examines everything flagged as “Jumbo” while the Conforming MCAI examines loan programs that fall under conforming loan limits.The Conforming and Jumbo indices have the same “base levels” as the Total MCAI (March 2012=100), while the Conventional and Government indices have adjusted “base levels” in March 2012. Using data from the MCAI and the Weekly Applications Survey, MBA calibrated the Conventional and Government indices to better represent where each index might fall in March 2012 (the “base period”) relative to the Total=100 benchmark.
The Total MCAI has an expanded historical series which gives perspective on credit availability going back approximately 10-years (expanded historical series does not include Conventional, Government, Conforming, or Jumbo MCAI). The expanded historical series covers 2004 through 2010, and was created to provide historical context to the current series by showing how credit availability has changed over the last 10 years – this includes the housing crisis and ensuing recession. Data prior to March 31, 2011, was generated using less frequent and less complete data measured at 6-month intervals and interpolated in the months between for charting purposes.
Source: Mortgage Bankers Association; Powered by Ellie Mae’s AllRegs® Market Clarity®