“Davidson” submits:
Once again everything which can be skewed negatively has been skewed negatively, yet fundamentals continue to trend higher. I think several key reports this week are helpful in getting one’s arms around the investing environment.
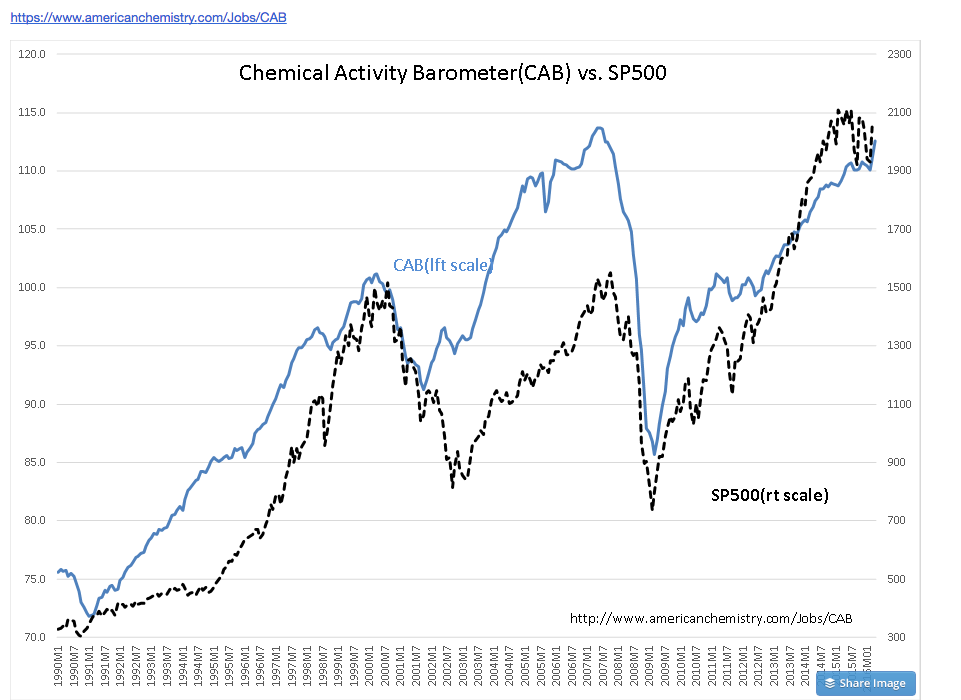
The 1st was the Chemical Activity Barometer(CAB). The CAB rose to 112.6. As an economic indicator which has been traced back to 1919, the CAB as a good history of reflecting the trend of US economic activity. The chart Chemical Activity Barometer(CAB) vs. SP500 reflects the strong correlation between this measure of economic activity and the SP500 ($SPY). With the CAB rising to 112.6, we should expect a higher SP500 in the months ahead. This economic indicator is a composite of indicators many of which are counts of things produced and transported. There is less dependence on the prices of goods and services which we see in other indicators such as Durable Goods Orders, Ind. Production, Hourly Wage Growth. All price based indicators suffer from inflation. When inflation is low, comparing different periods in price based indicators is almost always misleading. This is why inflation insensitive CAB, Employment and Vehicle Sales, which are physical counts of things, are providing positive economic readings while inflation sensitive Wage Growth, GDP, Retail Sales, Personal Income appear sluggish.
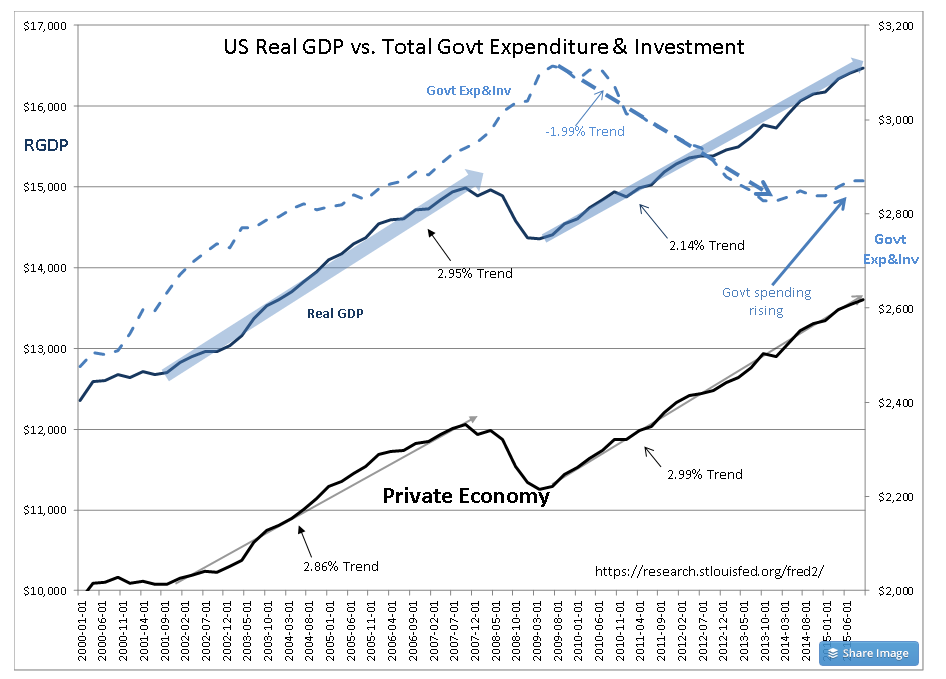
The 2nd was the US GDP report. If one uses inflation adjusted US Real GDP vs. Total Govt Expenditure & Investment instead of unadjusted data, the US economy today looks better than the last recovery. In this chart the Private Economy was separated from the total US Real GDP. What is surprising is that current Private Economy growth is slightly ahead even with Total Govt Expenditure & Investment having been in decline from 2008 to 2014. There has been a modest uptick in government military spending since 2014 as the US has increased its efforts in Iraq and Afghanistan against terrorism.
That the Private Economy has performed as well as it has with housing running at half its longer term pace I attribute to many US corporations embracing ‘Lean Mfg’ to enhance global competitiveness. The US embrace of ‘Lean’ has been a quiet revolution of employee engagement which has gone largely unseen except for very few observers. ‘Lean’ results in engaged employees which in turn results in giant steps in productivity, value delivered to customers and increases in personal income. ‘Lean’ in manufacturing and mining has as one of its many hidden benefits significantly reduced work related injuries which leads to improved productivity and overall lower corporate cost. ‘Lean’ is a revolution which has gone largely unnoticed.
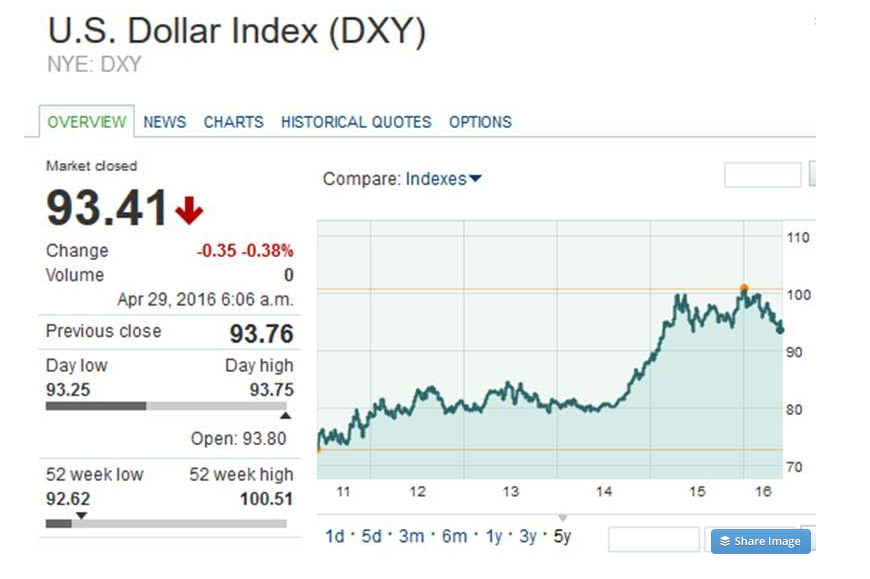
The last key report this week was the US$. I typically use the Trade Weighted US$ Index Major Currencies, but one can use the U.S. Dollar Index (DXY) ETF as charted on the Market Watch site, see link. The activity of the US$ has been the story of the past 2yrs. On the Russian invasion of Ukraine in early 2014, the US$ began to strengthen and forced Momentum Investor bets of a weaker US$ to reverse. In the process this took commodity prices lower as commodities are priced globally in US$. Oil fell from more than $100 BBL to ~$27 BBL in the process causing broad disruption across the global oil sector. The value of the US$ is determined longer-term by global trade, but Momentum Investors clearly demonstrate that they can have a short-term impact. The US$ peaked in Jan 2016 and is now reversing back to its long-term trend. A level in the low 70s for the U.S. Dollar Index ($DXY) ETF represents where this trend sits today. In response, oil (and other commodities) are rising.
Oil is well over $46 BBL this morning. The intense fear that excess oil production driving down prices of the past 18mos threatened to bankrupt corporations, banks and even whole countries has almost disappeared. What a difference a small shift in the US$ brings.
Market psychology on prices can be intense especially when many investors are leaning in the same direction. We have seen this multiple times even in the current economic/investment cycle. The only means investors have to not become caught up in this is to place inflation adjusted economic measures front and center in any investment process. Fundamentals eventually drive market psychology and this in turn drives equity and bond prices.
Economic trends continue to be positive for equity investors in my opinion. By equities/avoid long term fixed income.
http://www.marketwatch.com/investing/index/dxy