“Davidson” submits:
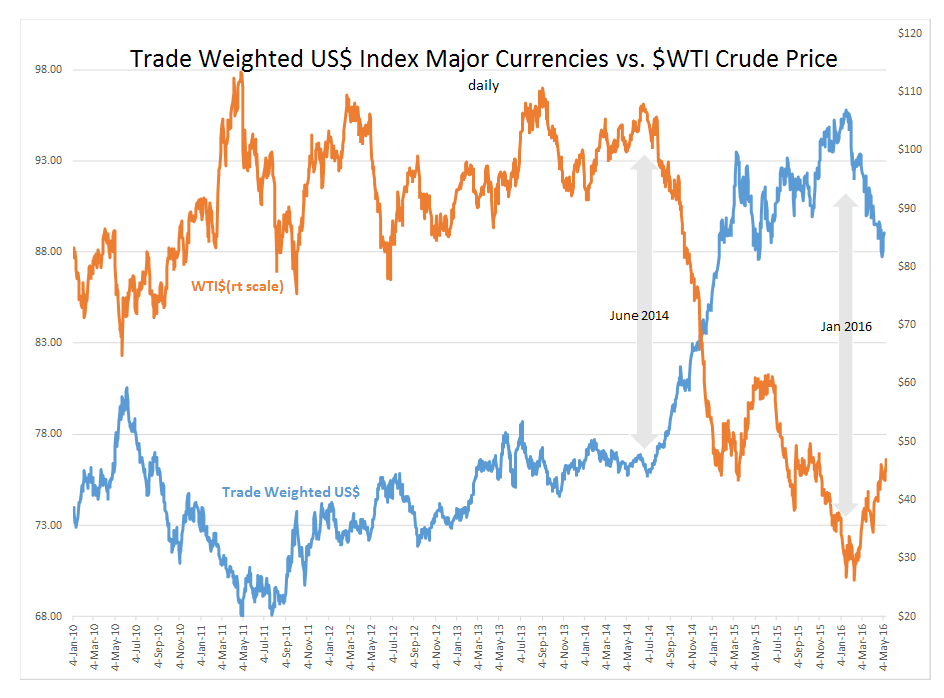
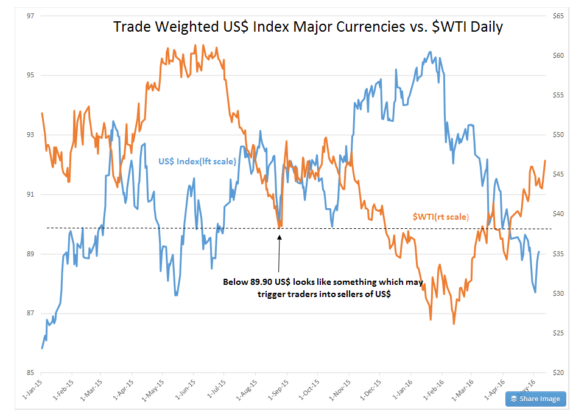
These updated charts show the relationship between $WTI and the Trade Weighted US$ Index Major Currencies. The 1st chart shows daily pricing from Jan 2015-Present while the 2ndchart provides a view from Jan 2010. Today’s pools of capital are seeking gains within the day-by-day trading frenzy. The least little shift is taken as the possibility of a new trend and capital shifts in anticipation.
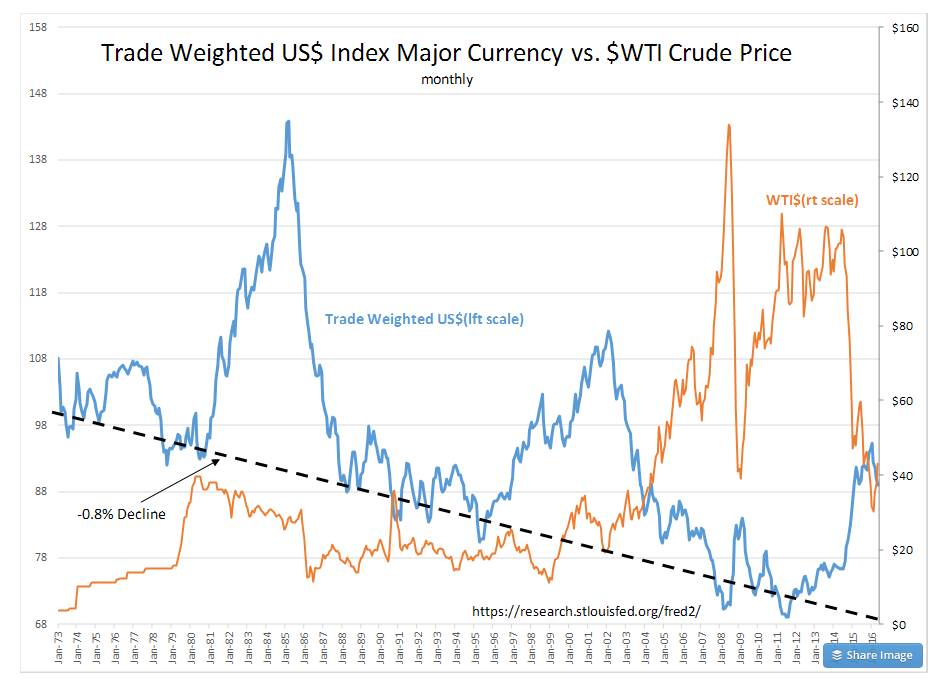
Most of the discussion today centers on whether it is oil or the US$ which is driving the correlation. This is like a discussion of which comes first, the ‘Chicken’ or the ‘Egg’. My perception is that the main driver in changing global trade balances. Even if one could unravel all the inputs we have on global trade, the data itself is incomplete with a number of nations treating global trade figures as state secrets. Global trade balances impact prices and currencies long term to produce the correlations seen in the chart from Jan 1973.
Perceived trends can be exaggerated when multiple pools of capital believe they have an investible theme. Suddenly, their thinking becomes the media’s headlines. It is in market psychology where we have experienced great swings unsupported by fundamentals as in 2008’s Peak Oil and again the belief that China would grow to consume a majority of the global oil supply 2010-2013 which suddenly turned into the concept of ‘Global Oil Glut’ in 2014-2015. What is next? Likely a swing back to not enough supply when Supply/Demand has likely been in its rough balance all along. Most investors today use price trends as if they are fundamental economic indicators and fail to realize that they are only investor market psychology. Many investors believe someone knows more than they do and they think trends reveal this. Basically, global oil Supply/Demand data is incomplete and leaves plenty of room for investor assumptions.
Behind the scenes, global trade prices currencies based on productivity and national politics in a process the detail of which no one is able to predict year-to-year. The Trade Weighted US$ Index Major Currencies from Jan 1973 has a long term fundamental pattern which does make sense. The US as the ‘Free Market’ economy(mostly ‘Free’) invents and innovates its society forward and in the process of global trade improves its standard of living and that of countries with which we trade. As a result, the US$ is in gradual decline of -0.8% as we elevate the currencies of our trading partners. There were two instances in this history when the US grew its GDP faster than our trading partners. These periods resulted in Trade Weighted US$ Index Major Currencies spikes in 1981 to 1985 and in 1995 to 2000. The current spike in the Trade Weighted US$ Index Major Currencies has been without the US outgrowing its partners. For this reason one can label the current spike in Trade Weighted US$ Index Major Currencies as due to pure speculation and trace this back to the Russian invasion of Ukraine 2014. In my opinion we can expect global trade balances to gradually pull the Trade Weighted US$ Index Major Currencies back to its long term trend as the current short term speculation of a ‘Global Oil Glut’ is unwound.
These charts coupled with fundamentals show that we are correcting the recent ‘Global Oil Glut’ speculation. In my opinion the normalization of Trade Weighted US$ Index Major Currencies is investible.