“Davidson” submits:
“U.S. Worker Productivity Hasn’t Been This Bad Since 1993”
May 4, 2016 — 12:01 AM EDT http://www.bloomberg.com/news/articles/2016-05-04/u-s-worker-productivity-hasn-t-been-this-bad-since-1993-chart
I encourage you to view the link to this Bloomberg article.
This point of view is typical of the pessimism we have experienced since 2009 as markets crawl higher. I often look at the headline of the moment and find that consensus headlines are well off the mark. The major issue is people do not use Real GDP and they do not correct it for government spending. Inflation has been much higher in the past and this makes it appear that the current economy is slow when wages and prices(production) are not adjusted for inflation. The same is true for government spending which has varied over time. The past few years Government Expenditure & investment has fallen in real terms as military spending has declined. In order to get to a better history to compare today’s economy with that of the past, I subtracted Real Government Exp&Inv. From Real GDP to look at US workforce productivity which so many seem to view negatively in today’s pessimistic climate.
There is concern that the US workforce is somehow losing its productivity. There has been a slowing over time, but not nearly the decline many claim. It is all how one looks at the data. We count Government Expenditure & Investment as part of GDP. All spending derives from the Private Economy through taxes or support of government borrowing. In my opinion it is better to look at what is left of the Real GDP once stripping out Govt Exp&Inv. The study of economics as we hear in the media is fraught with political bias.
“Figures don’t lie, but liars figure.” Carroll D. Wright, a prominent statistician employed by the U.S. government. 1889
While there are individuals who skew statistics to suit to support politically biased statements, most individuals are sincere in their use of economic data. The issue lays in the belief that one can use the economic numbers provided by government sources as is. GDP is GDP, right? It has been with us forever and always worked for past analyses, right? Just because one can get a number for something does not mean that that ‘number’ actually measures what is intended. In the current environment, there is an incredible mismatch between economic fundamentals and the perceptions of investment advisors. It comes from not knowing what the economic numbers mean. Some numbers like GDP are composites of other data.
In recent notes I showed that inflation adjusted wage growth is no different than what we have seen in past economic cycles. Inflation adjustment is required to show this. Wages have always grown at a faster pace then inflation long term. I also recently showed that it is the Real Private Economy which is growing at ~3% and that this is in line with historical norms. It is the Real Private Economy which supports stock prices, not the actions of the Fed. If there is no earnings growth, then stock prices do not provide the returns which make them attractive to investors. Market will not rise without earnings. The consensus perception is that we currently have historically low economic activity and even negative wage growth. They believe markets have risen purely because the Fed has kept rates low. In my opinion, history does not support this assertion. Current pessimism has no fundamental support if one takes the care to use the appropriate data. The same is true with the current assessment “U.S. Worker Productivity Hasn’t Been This Bad Since 1993”
Using Real Private Economy data in 3 charts results in Productivity relationships without the distortions of inflation or changes in government spending and provides better detail how Productivity gains enter the economy.
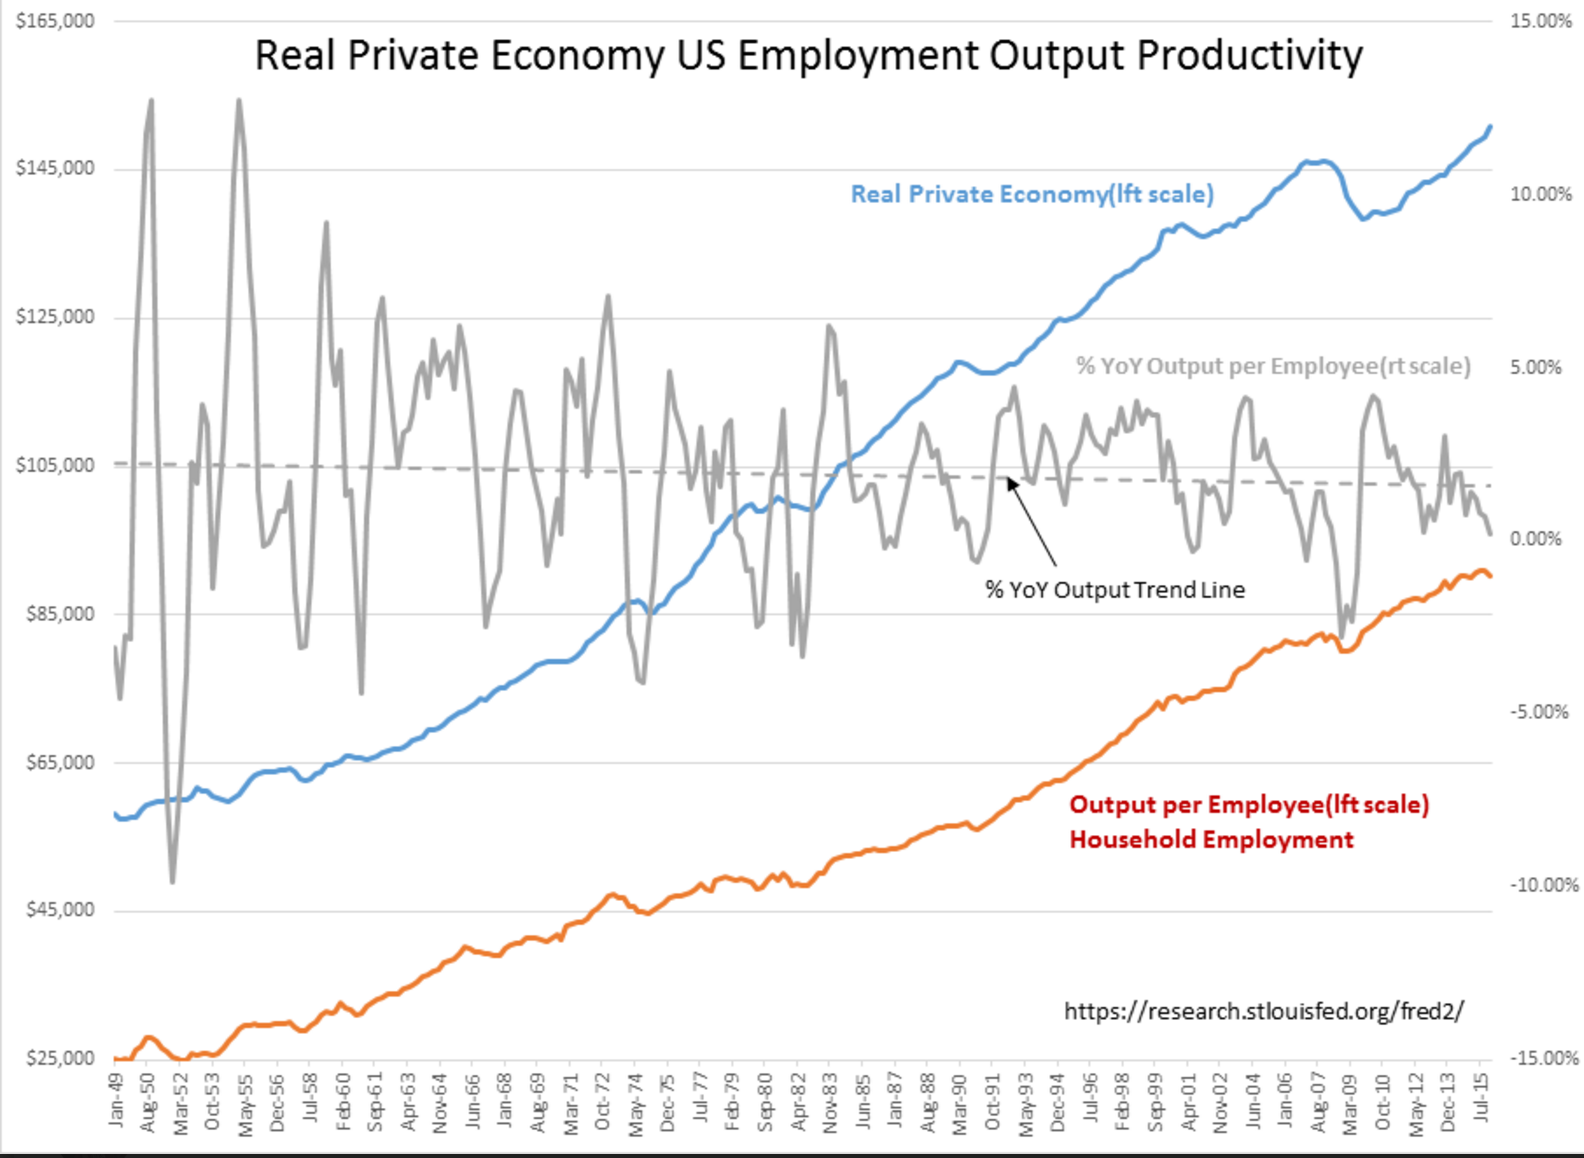
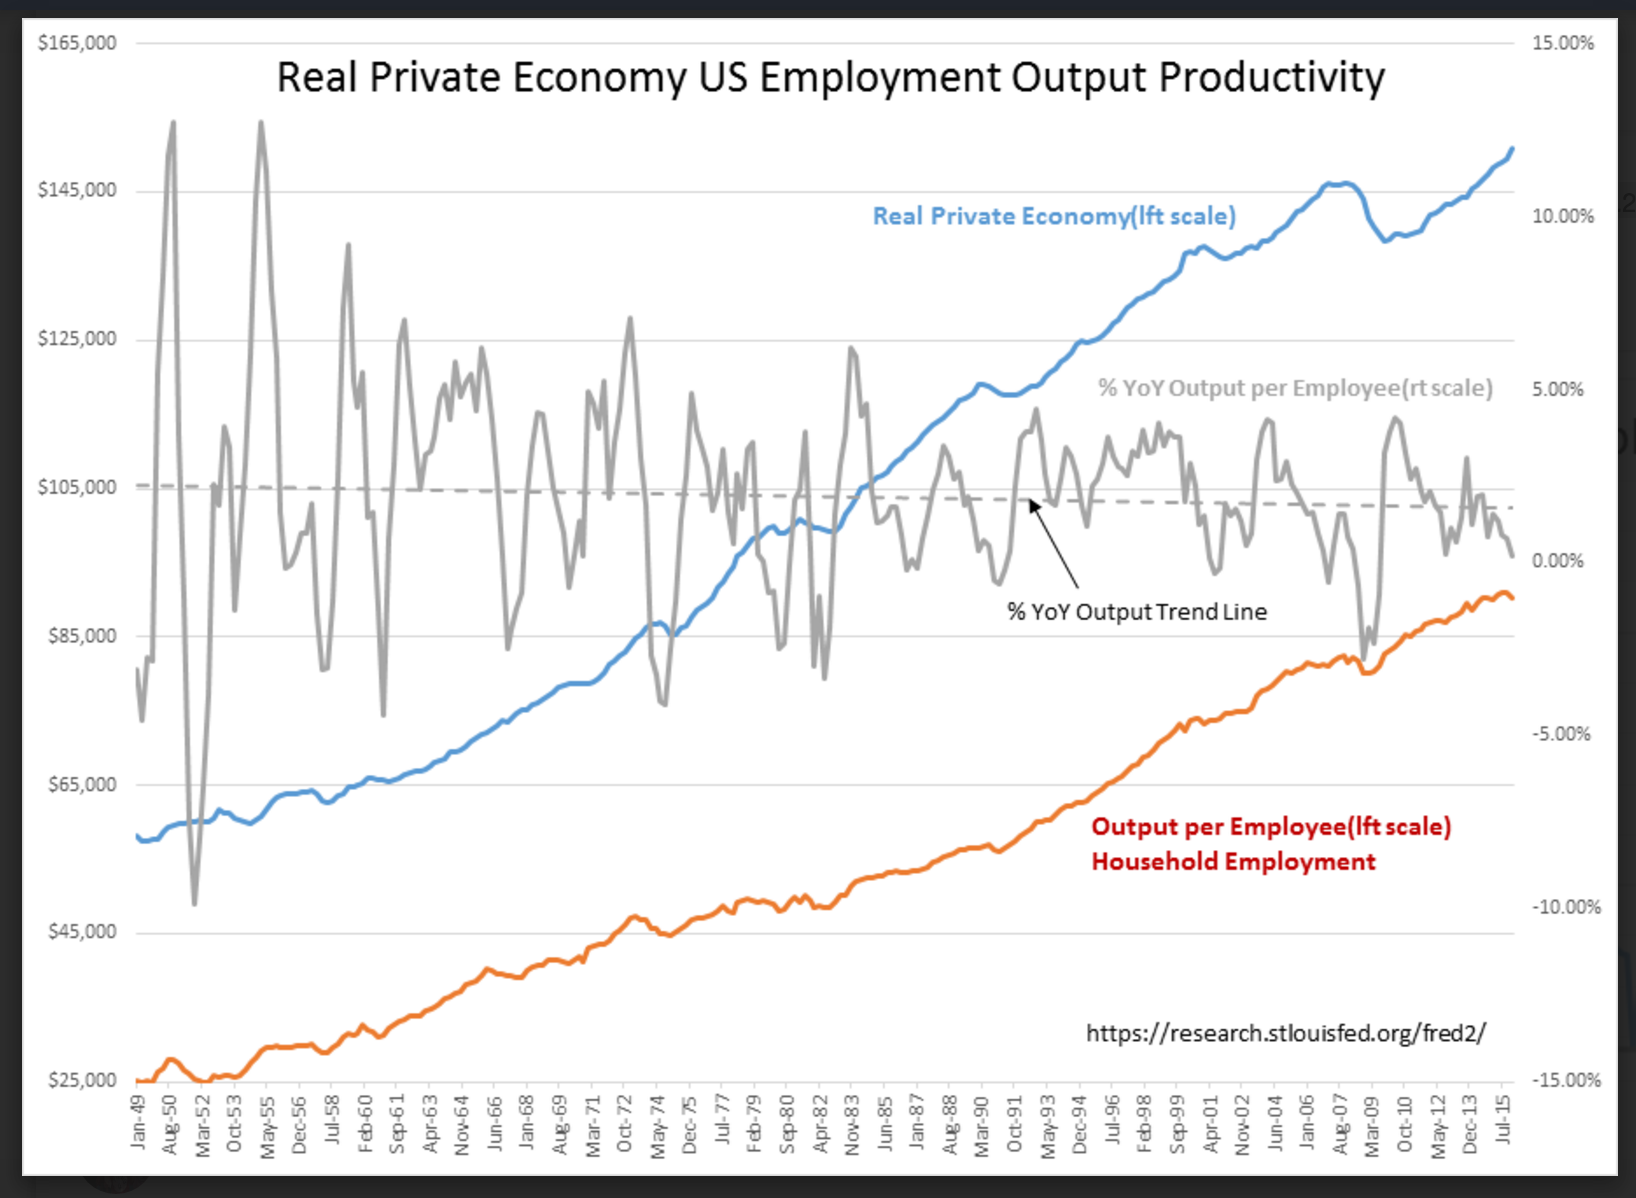
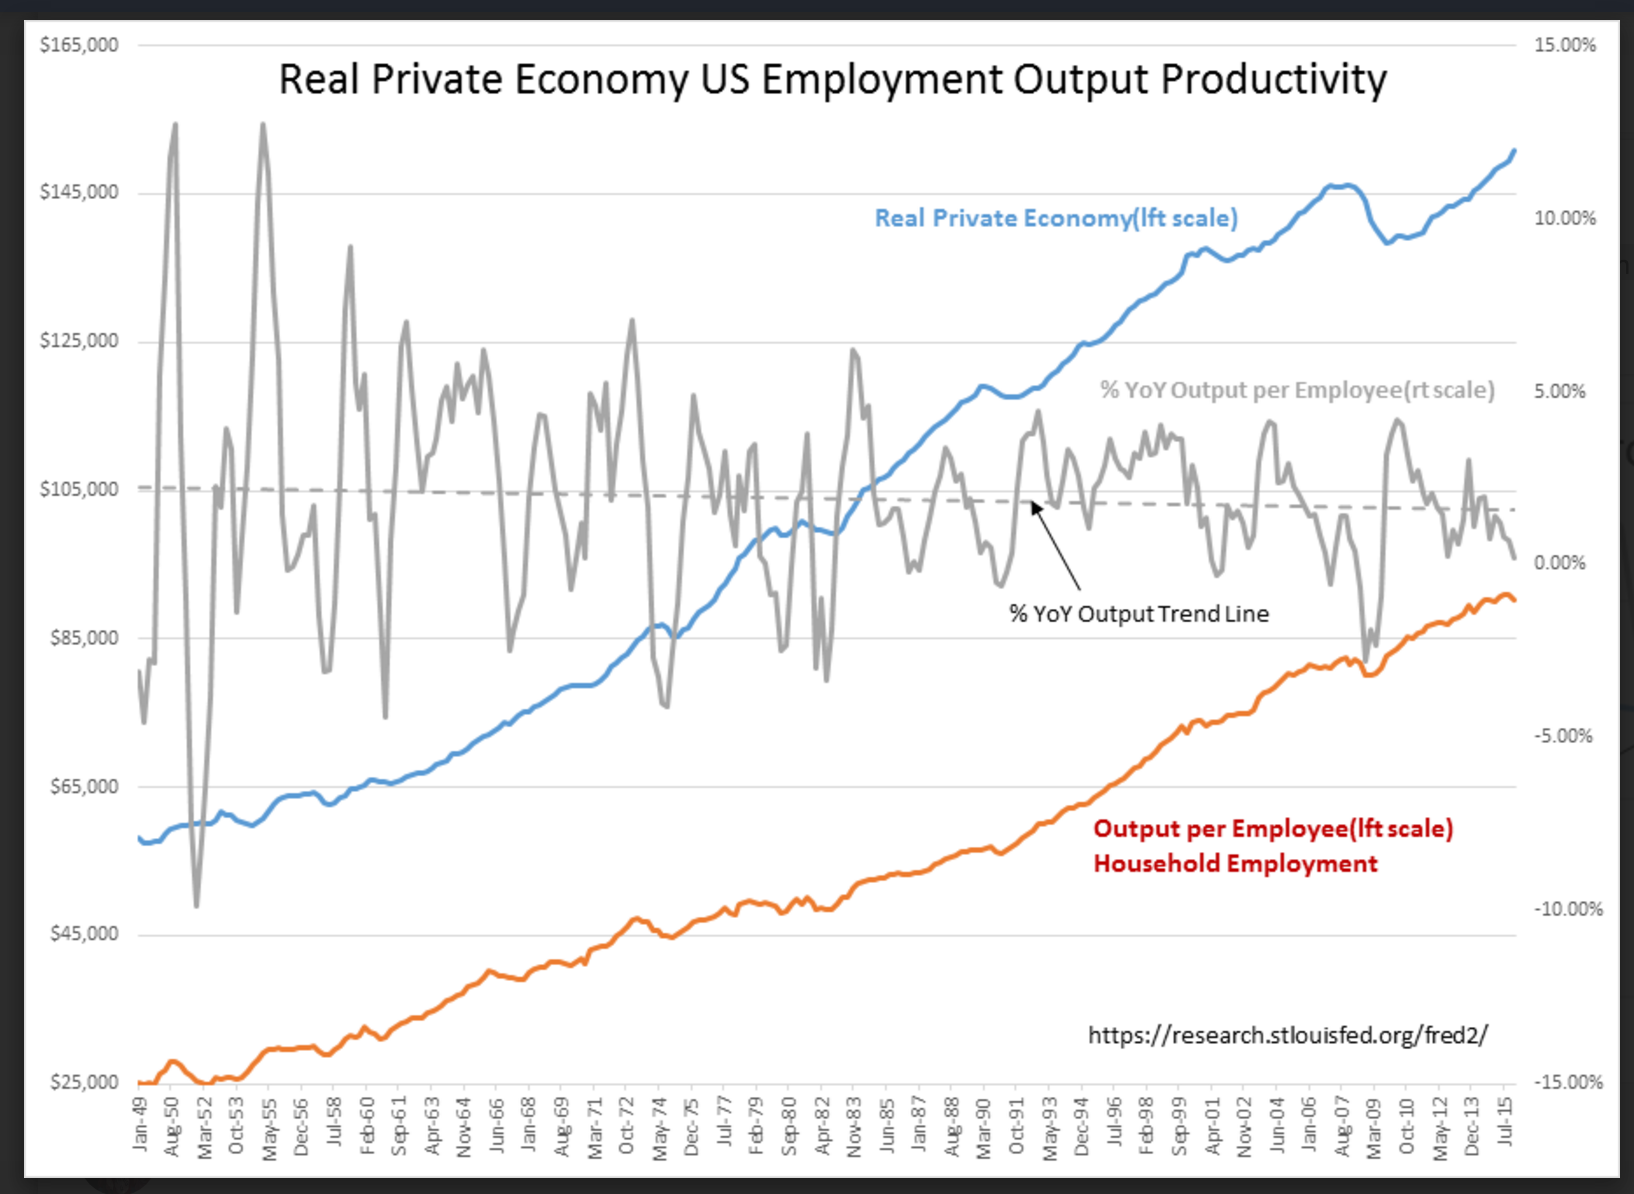
1) 1st chart shows the history from Jan 1948 using Household Employment as the measure of total employment(includes self-employed which other measures do not).
2) 2nd chart shows the % Change Year over Year Output per Employee by itself with Jan 1948 regression beginning at ~2.2% ending Jan 2016 at ~1.7%
3) 3rd cart shows Jan 1990- Jan 2016 in which one can see that a rise in hiring first causes a lag in productivity which then rises ~3yrs later.
That productivity has slowed somewhat over time is likely do the US economy growing from $1,4Tril(chained 2009 dollars) to ~$14Tril(chained 2009 dollars). Importantly, Productivity expectations based on unadjusted GDP historical data in the range of 3%-4% are unrealistically high when they have never averaged at those levels. Being concerned about near term Productivity gains is likewise unrealistic as it appears to take about `3yrs for newly hired employees to add to Productivity.
The US just had a recent uptick in Household Survey Employment which can be seen in the 1st chart. We should expect a near term decline in Productivity with increases coming ~3yr out.
Rising inflation adjusted-output per person, rising inflation-adjusted personal income and of course rising employment is highly correlated to increases in corporate earnings which are the drivers of higher market prices. In my opinion, investors should favor equity over debt and ignore current market volatility.