“Davidson” submits:
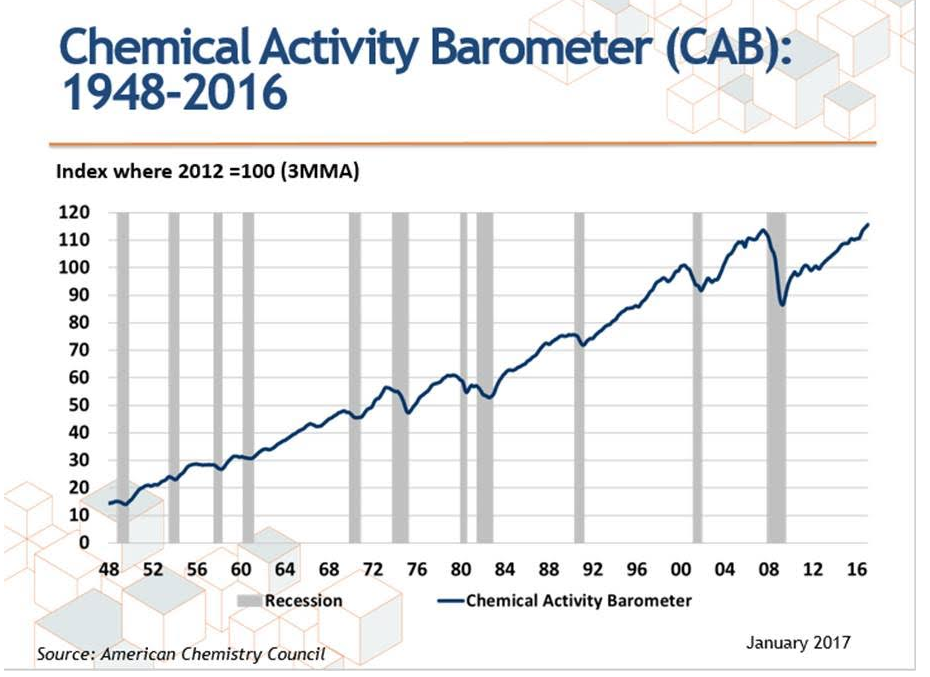
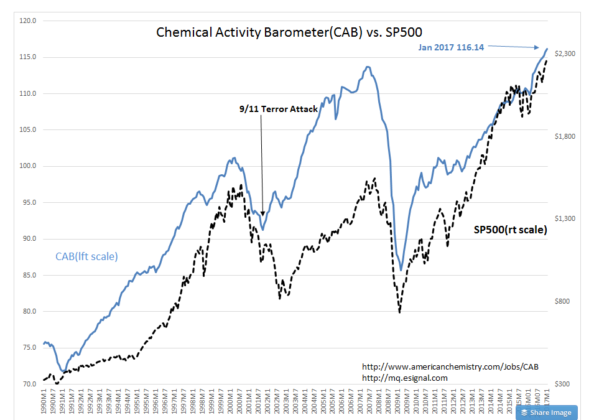
The Chemical Activity Barometer(CAB) for Jan 2017 rises to a new record high at 116.14. The CAB history is shown vs. SP500 Jan 1990-Jan 2017 and shown from Jan 1948 with official recession periods.
From the CAB Fact Sheet: https://www.americanchemistry.com/Jobs/CAB/
The CAB is a composite index which is comprised of indicators drawn from a range of chemicals and sectors, including chlorine and other alkalies, pigments, plastic resins and other selected basic industrial chemicals. It first originated through a study of the relationship between the business cycles in the production of selected chemicals and cycles in the larger economy. Other specific indicators used include:
- Hours worked in chemicals;
- Chemical company stock data; publicly sourced, chemical price information;
- End-use (or customer) industry sales-to-inventories; and
- Several broader leading economic measures (building permits and ISM PMI new orders).
The correlation with SP500 is quite marked. The SP500 reflects investor market psychology. Investors perceive current economic activity in conjunction with future expectations. There are times such as 9/11 when many investors remained fearful even 12mos after economic activity turned higher. The only investors with positive outlooks at the time were Value Investors. Many investors expected further economic collapse, especially Momentum Investors. This was an additional collapse which did not materialize. Such pessimism had no support from multiple economic indicators. Historical market valuation from the Value Investor Index indicated the SP500 prices offered good long-term values at the time. Nonetheless, most investors remained highly pessimistic till Sept 2002 when the SP500 reached its low for the cycle. It is periods such as this when Momentum Investors who are price-trend followers express widely divergent perceptions from Value Investors who invest with regard to long-term business fundamentals.
The turn in SP500 12mos after 9/11 reflects the divergence of Momentum Investor vs. Value Investor perception
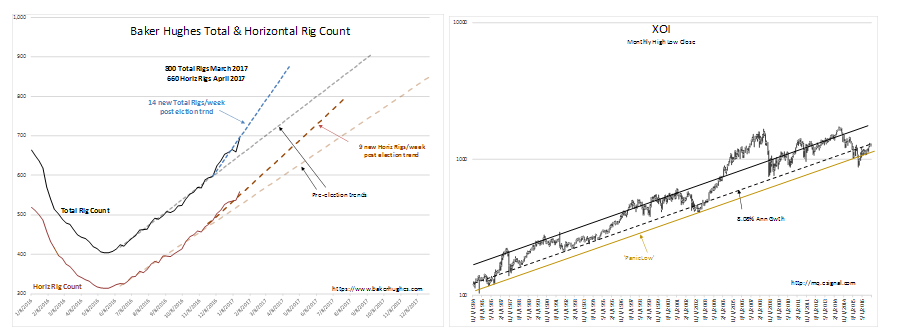
The CAB is correlated to the US$(not shown), the oil/gas industry recession 2014-2016 and the XOI index of publically traded exploration/production companies. The CAB began its slide sideways with the 2014-2016 fall in the XOI. US$ strength resulted in oil price collapse. Supply/Demand data available do not reflect the long discussed ‘oil glut’. The data(not shown but available on request) shows a fairly smooth rise in US demand for crude and consumption. In fact US Exports of Refined Petroleum Products to meet global demand has risen smoothly by 200% over Jan 2010’s level. Oil prices appear to have fallen in response to a US$ algorithm used by Momentum Investors. Falling oil prices with a rising US$ had their impact. The XOI reached the ‘Panic Low’ level in Feb 2016 at 1011 while the Baker Hughes Rig Count bottomed at 404 rigs in May 2016. Todays Rig Count is 72% higher at 696. XOI pricing has only reached its lower long-term trend. Much higher prices appear possible.
Markets and economic indicators are highly correlated with each other even if the former is priced by market psychology and the latter by economics.
Markets reflect what investors think people are doing-Economic indicators measure what we actually doing.
The fact that market psychology obscures this relationship occurs when short-term price-trend followers, Momentum Investors, believe that short-term volatility in economic indicators carries information on which they can trade. Short-term economic report volatility is nothing more than the statistical methodologies used in economics. Economic measurement is not able to capture in real time the slow and relatively smooth progression of economic trends. Value Investors know this and invest by smoothing monthly economic reports into trends thus ignoring the month-to-month wiggles on which Momentum Investors focus. Value Investors perceive short-term volatility as insignificant in their long-term perception of the business cycle.
Over the long-term, market psychology is driven by business economics, i.e. market psychology follows, it does not lead
Market psychology is highly undisciplined investing. There is precious little behind it. It is the belief that prices carry all the information investors need. All one needs do is locate a price-trend and follow it. Price-trend investing is highly popular. There is even a Chartered Financial Analyst certification called the Chartered Market Technician® (CMT). Seeking no deeper analysis to what is behind any investment than its price-trend is analysis based on nonsense in my opinion. Yet, the financial reports and forecasts presented in the media based on price-trend following Momentum Investors (most Hedge Funds) overwhelm the commentary provided by business fundamental based Value Investors. It is what it is!
Value Investors using economic indicators anticipate changes in market psychology. This occurs because Value Investor long-term perspective recognizes long-term economic themes well before they show in price-trends. Economic indicators such as the Baker Hughes Rig Count, the XOI and the CAB are showing an important and positive turn is occurring while most investors remain pessimistic regarding oil/gas and industrials.
While the general economy has continued to rise as indicated by vehicle sales, retail sales and employment, the oil/gas and industrial sectors experienced a recession 2014-2016. The apparent recovery in these lagging sectors should spur general economic expansion for several more years. I continue to recommend investments in oil/gas and infrastructure related issues. As the oil/gas and industrial recovery continues, investors historically come to recognize opportunities to profit and these issues tend to rise.