“Davidson” submits:
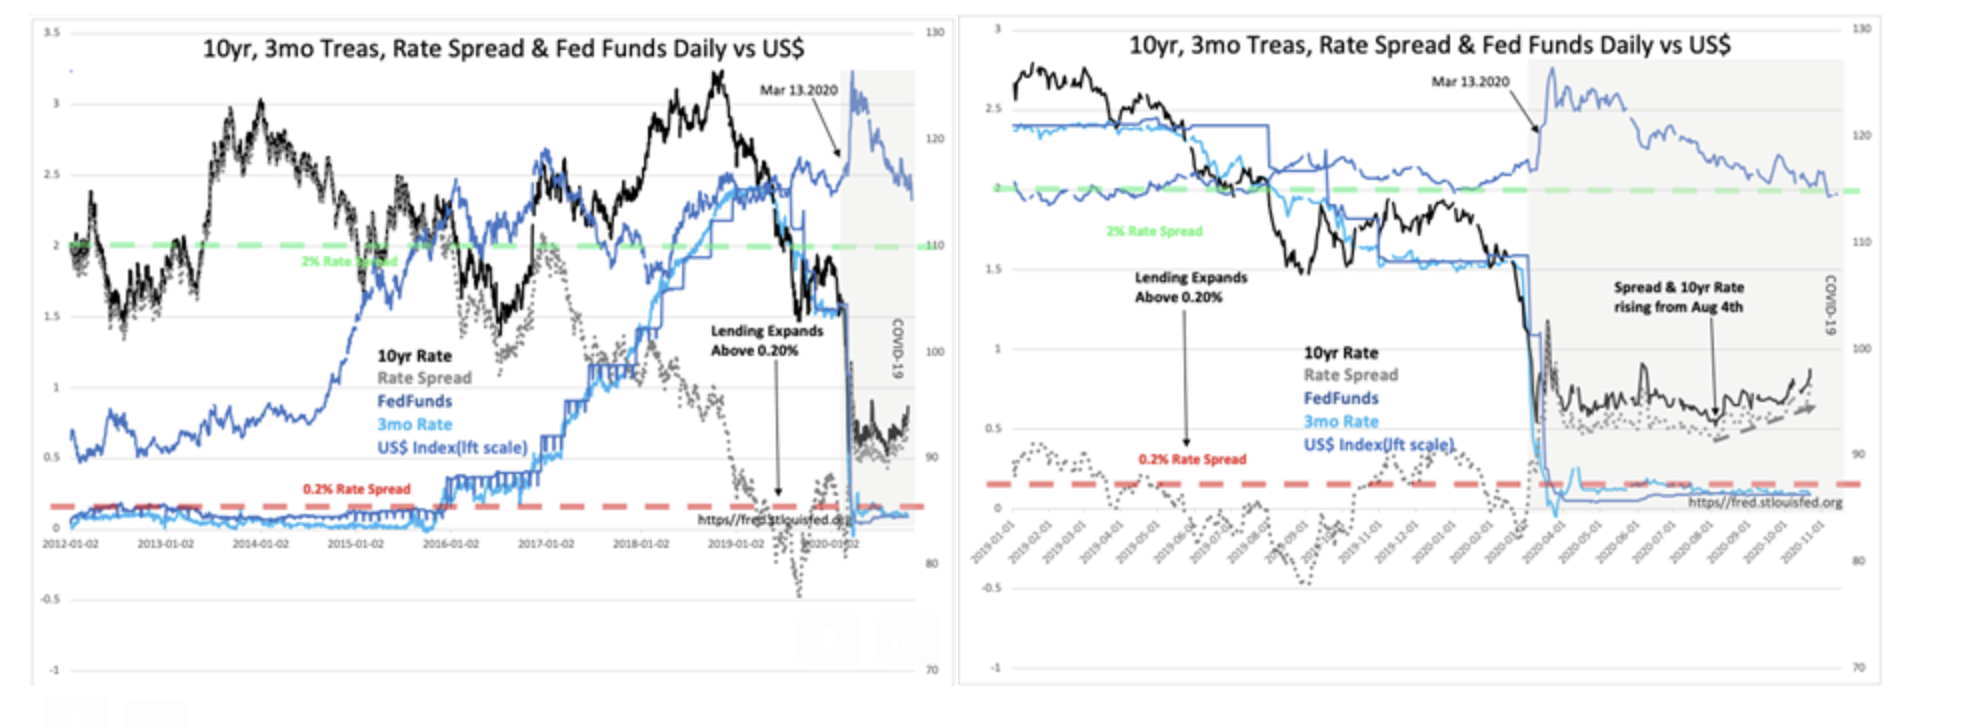
Two charts, daily data from 1/1/2012 & 1/1/2019, show shifts in rates, the T-Bill/10yr Treas Rate Spread and US$ pre/post COVID-19.
- T-Bill/10yr Treas Rate Spread inverted May 2019 on recession scares/did not materialize
- Panic of COVID-19 drove capital to US resulting in sharply higher US$ March 2020/Recession Mar 2020
- Flood of capital into US due to short-selling ban in Eurozone US$ rose ~10% in 3days
- US$ normalizes to pre-COVID-19 levels Nov 2020
- 10yr Treas rates begin rising Aug 2020, Rate Spread widens from 0.5% to 0.8%+ Nov 2020
While we are still in the NBER(National Bureau of Econ Research) declared recession period, it is clear that the T-Bill/10yr Treas Rate Spread is widening. This has been historically a sign of investor economic sentiment shifting to greater optimism. Rising 10yr Treas rates typically represents capital shifting into equity situations, public and non-public. It is the widening of the spread that is important, indicating that lenders receive higher profits on lending which spurs more lending.
Historically the T-Bill/10yr Treas Rate Spread can widen to ~2% range as economic confidence builds over time to a level indicating a high level of investor speculation. The ~2% spread is a useful market speculation indicator and represents past extremes of investor optimism. The excessive risks taken by investors have in the past begun to reveal themselves via higher loan defaults which evolves into shifting investor optimism to pessimism at cycle tops.
Market psychology has a cycle. It takes a number of years to shift from pessimistic levels to levels representing excessive risk taking. The T-Bill/10yr Treas Rate Spread is helpful measuring investor sentiment. At the moment, conditions remain in early stages of shifting to higher levels of optimism. Equity markets have considerable upside the next few years by this measure.