“Davidson” submits:
The Value Investor Index has 3 components, the long-term mean earning trend for the SP500(DASHED BLACK LINE), the long-term Private GDP Trend from 1947-2020(currently 2.92%) and the 12mo Trimmed Mean PCE(currently 1.71%).
The long-term earnings trend is capitalized(divided by) the Natural Rate which is the addition of the Private GDP and 12mo Trimmed Mean or 4.63%.
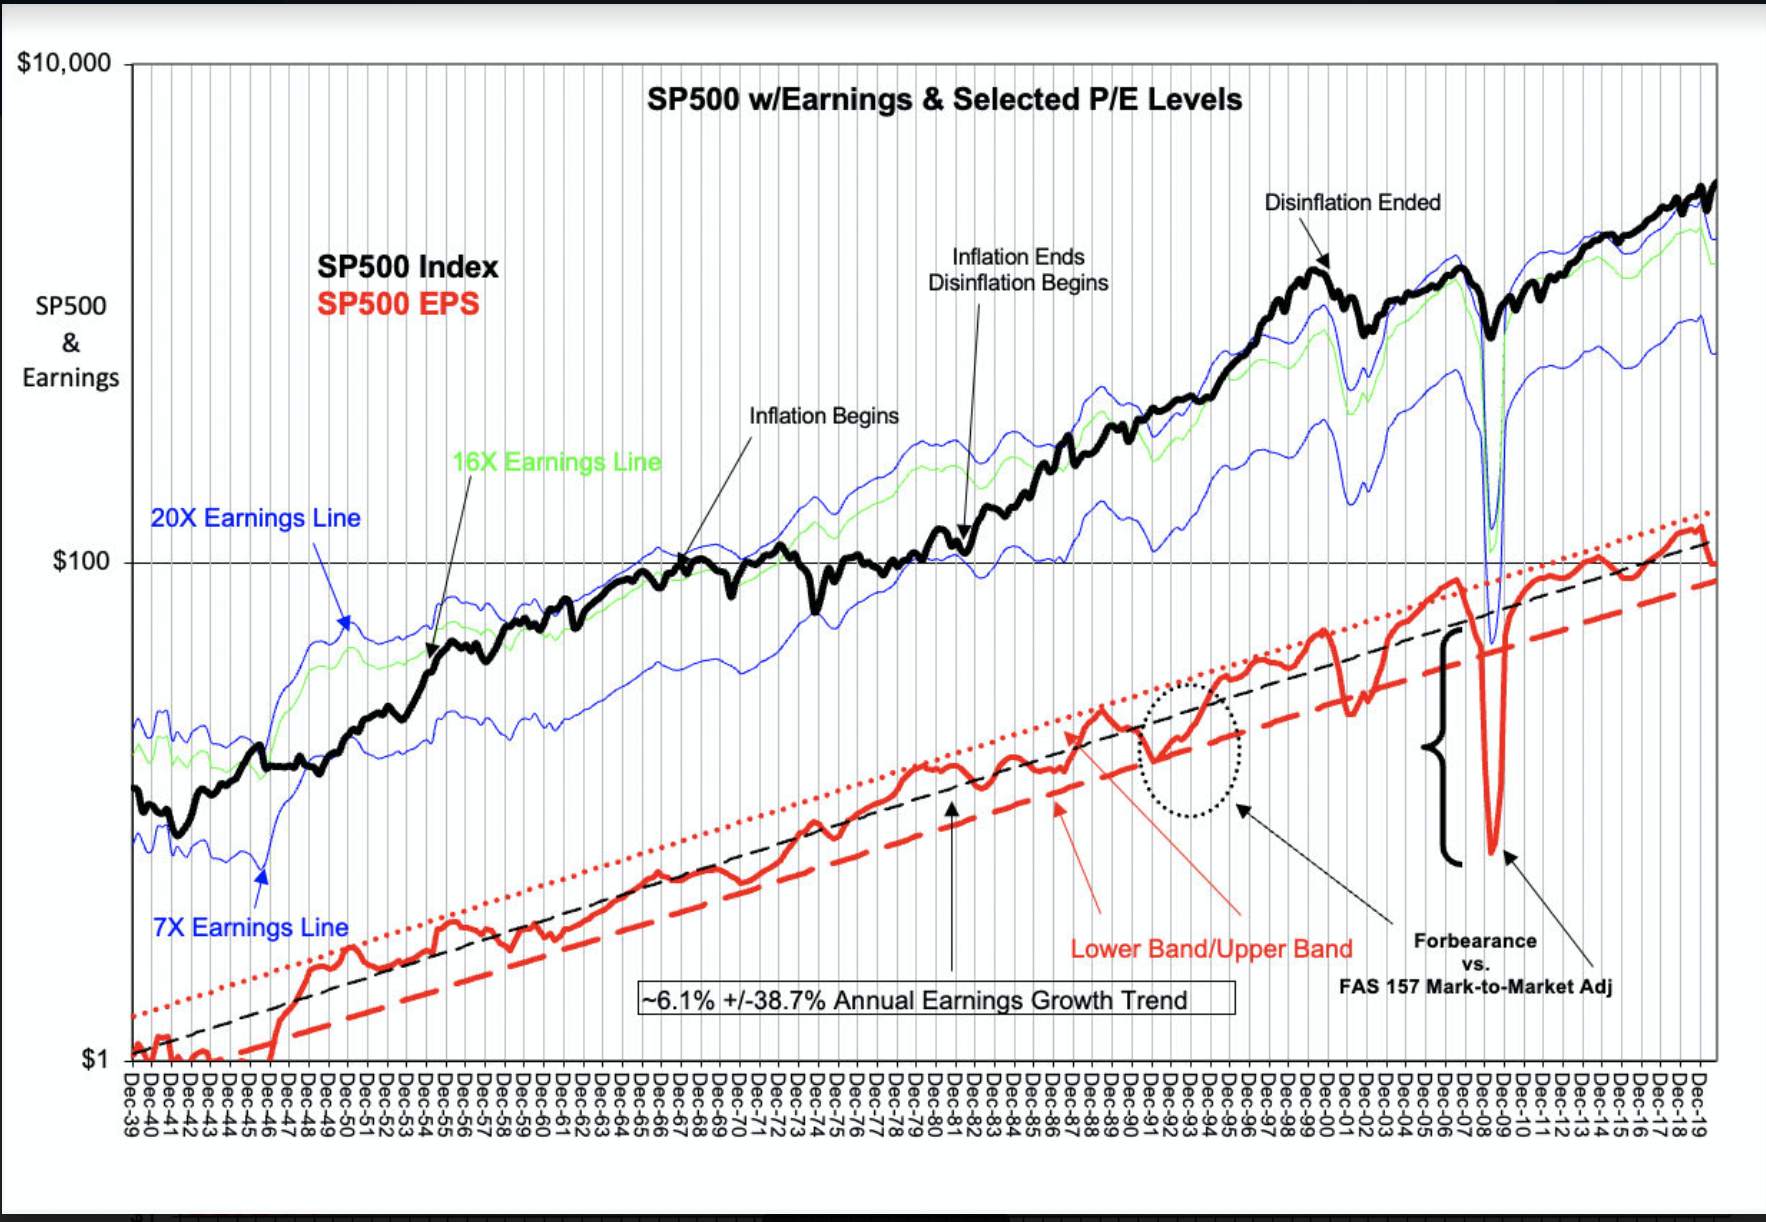
Even though the long-term data is updated as released, one must periodically review to make sure shifts in self-governance have not resulted in a fundamental shift in returns. Thus far even though Trump’s policies have bettered the playing field for US Employment over prior administrations, the rise in SP500 EPS(RED LINE) was cut off by the COVID-19 lockdown.
Periodic review is always necessary to make sure we are not fooling ourselves with data. The difference between the SP500 and the Value Investor Index is measure of overall market psychology vs valuation It is not short-term but becomes important at extremes. Improved or worsening self-governance impacting the EPS trend can have an impact. Reassessment of past assumptions always require review. The US economy is a large system within in a global arena of less productive economies and has always adjusted leaving the SP500 EPS earnings trend at 6.1% +/- ~38% swings from the mean. (RED DASHED & DOTTED LINES)
Thus far, no change.