“Davidson” submits:
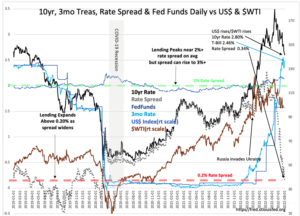
The T-Bill/10yr Treas has a stellar history (since 1953) of proving to be an excellent indicator of market psychology. When T-Bill/10yr Treas Rate Spread narrows to 0.2% or less has proven to signal overt financial speculation in markets and a good exit point for equities across all asset classes in anticipation of a severe financial correction/recession. In the past, this occurred with investors driving capital into equities with overly bullish sentiment headlines nearly ubiquitous. The effect is that investors drive T-Bill rates high enough to invert already elevated 10yr Treasury rates thus creating the classic condition of yield curve inversion. While we have such a narrowing today and may even invert in the classical definition, today has significant differences.
No two markets are the same. Markets never repeat because conditions and sentiment is at any point in any cycle is always operating with innovations, government policies, geopolitical events and investor technologies not present in any previous cycle. Greek philosopher Heraclitus’, 544 BC – 483 BC, observation is as relevant today as when he first stated:
“No man ever steps in the same river twice, for it’s not the same river and he’s not the same man.”
The differences today include a high level of pessimism, surveys indicate 60% forecast recession, highest cash to equity allocations since 2008 and heavy use of trading algorithms to hedge portfolios. These factors combine to drive reserve capital normally kept in T-Bills as a hedge holding these rates low into active hedges shorting oil, other commodities and equites with the net effect that T-Bill rates have been driven higher on pessimism. This is opposite of past panics where T-Bill rates fell as capital sought safe havens. That $WTI has plummeted on continued tightening of supplies due to government policies, a condition that is well known, has been ignored with the desire to hedge downside risk to economic activity. The stream of 2Q22 earnings reported thus far give no indication of the anticipated slow down with many companies involved in core economic activity issuing revised higher guidance.
The algorithms used to hedge portfolios are keyed to short oil and to bet against equities on expectations of economic correction. One of the signals to short is an interpretation of ‘yield curve inversion’. The media has headlined 2yr/10yr, 5yr/10yr and even 5yr/30yr inversion concerns none of which has been cited in prior market tops. It appears that these are drivers of hedging decisions in the current market that is likely responsible for moving capital out of T-Bills and into hedges driving these rates higher which in turn enhances the strength of the pessimistic algorithm signal. But “,… it’s not the same river and he’s not the same man.” There remain strong indications of economic growth accelerating with quite a few skilled managements indicating the same.
I continue to recommend being fully invested in equities of well managed companies reporting rising guidance for revenue, cash flow and net income.
Remember to keep this factoid in mind: The Fed does not set rates. Rates are set by markets and the Fed follows. This is what the historic data proves, not the concept that the Fed controls rates. The current Fed Chairperson is not Paul Volcker and has a history of following market rates with Fed Funds rates. If T-bill rates rise more, the Fed Funds rate will rise again, but if T-Bill rates fall, then Fed Funds will, after a multi-week pause, also fall.