For those who may be wondering, “Davidson” was calling for commodity prices to begin to fall as far back as 2012. I’ve linked to a couple posts where he speaks to the “Financialization of Commodities” in 2012 here and here . The average investor a decade ago had no real way to bet on the price of commodities. Now, with a glut of ETF and index funds that track their prices and then enter the futures markets, every investor of any ability is able to wager of the prices of the commodities. For proof, my 11yr old, who has a brokerage account I let him trade at will was talking yesterday that “it might be time to buy some oil dad”. This has caused commodity prices, once more reflective of the supply/demand situation to now become detached from that.
If anything, the large drop in oil and copper ($HG_F) should be looked at as hugely bullish. The drop in oil ($USO) has lead to gas prices falling ~$.50 YOY, that means ~$50B more in consumers pockets.
“Davidson” submits:
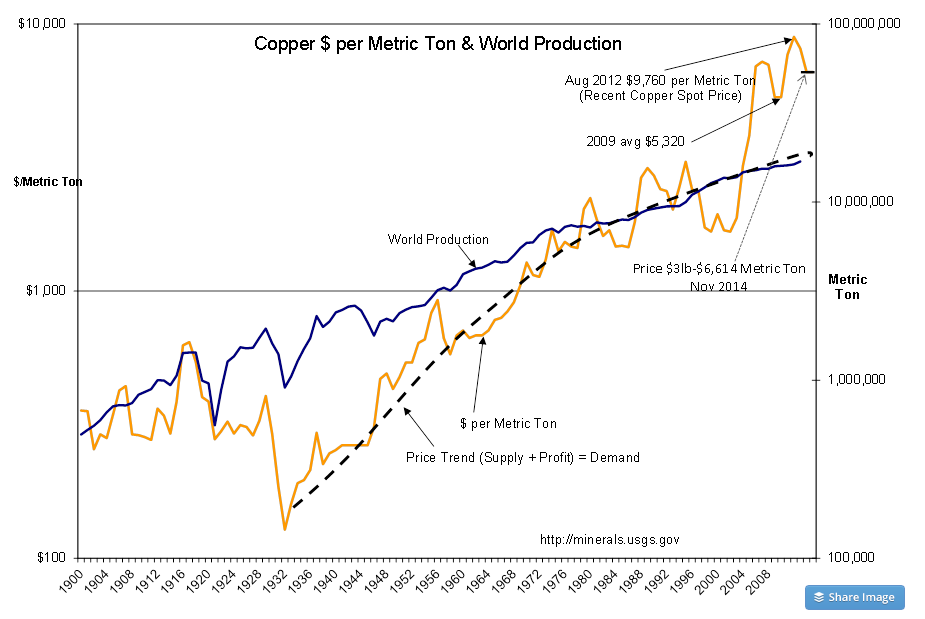
You remember “Dr. Copper”. For years copper has been thought a useful indicator of economic trends, i.e. “Dr. Copper”, but like anything else it has become ‘financialized’. Copper has become a means by which investors can bet on perceived future investment trends other than construction. This changed as China entered the market for material to build out its cities and infrastructure. The demand for copper soared on state directed investment. One can see this in the price history chart from the US Geological Survey below. Copper saw a sharp surge in copper demand beginning in 2003 with China’s directed building activity. China did this to offset the global recession Apr 2001-Dec 2001. A copper price correction in 2005 was followed with another surge in 2012 on China’s additional stimulation to offset the recession of 2008-2009 to $9,760 Metric Ton($4.42lb). Simultaneously this caused investors to believe that China’s building activity was going to create global scarcity for years. Investors subsequently bid copper higher on this perception and the perception that the Fed’s various liquidity moves would create hyperinflation in the US. Many have expected the collapse of the US$. Little watched was also a unique business practice to hedge loans in China by backing them with copper ingots. Chinese lenders thought copper act as a liquid asset backing debt of questionable borrowers in a system of little transparency or history. Using copper in this manner also was thought to work as a currency hedge as the Chinese government weakened their currency in response to its largest trading partners. This is how copper became ‘financialized’. Copper pricing no longer reflects a simple economic supply/demand relationship based on construction trends but now has multiple inputs. Copper is no longer “Dr. Copper”!
Copper just yesterday fell below $3lb. China’s true demand remains very hazy. China has many empty cities, real estate prices which Jim Chanos said would plummet in 2009 are in fact falling sharply if not plummeting. China’s banking system is experiencing defaults. Some of this copper used as hedges is coming back into the market? But, it is hard to say how much with China a Command Economy which does not release measures of its economy free of political influence. If one reverses the surge in copper prices since 2003 and estimates that its long term trend is a more natural price level without recent influences(see the dashed line), one can estimate a price closer to $2lb today. $2lb copper equates to $4,412 Metric Ton or 33% lower than it was priced yesterday.
In my opinion the recent strength in the US$ has been due to the reversal of the hyperinflation trade which a number of Hedge Funds implemented in 2010-2012. This equates to rapidly falling oil prices and the recently witnessed sharp spike in the value of 10yr Treasury(i.e. sharp fall in rates to ~1.9%, have since rebounded to 2.35%). Some have equated this activity to a sudden excess of oil. While there has been a gradual increase in supply due to US fracking, there has not been a sudden global supply excess. The widespread belief that oil is suddenly being produced in excess has been countered by Saudi Arabia which says recent price changes are solely do to market forces. The media has strongly disagreed!
I find myself in agreement with the statements out of Saudi Arabia. Falling oil represents nothing more than traders reversing a mistaken perception of the future. Copper is likely to show similar weakness. Previous financial reasons for owning copper are no longer valid!
Falling commodity prices at this point have some interpreting as due to global economic weakness. Nothing could be further from the economic facts. As I have shown week after week, month after month, employment indicators are marching higher. If there is one true sign of economic growth, it is the direction of employment trends.
In order to separate out the many crosscurrents which impact investor thinking one needs to be able to hang on to those fundamental themes which ring true through history and learn to ignore the noise. Oil, copper and etc have become ‘financialized’ and are just sideshows. It is the “Big Picture” which matters most.
Commodities can run counter to economic fundamentals. Stick with the fundamentals!! Buy stocks ($SPY)!!