“Davidson” submits:
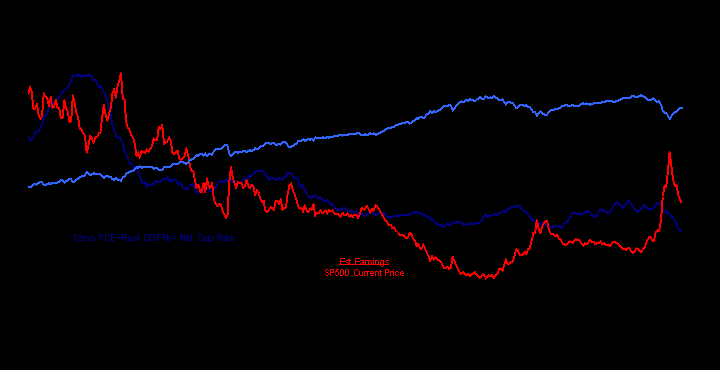
I run this monthly. This is the core of my market analysis. This approach is helpful if you know the limitations.
Based on the concept that free markets set rates of return, this series is based on the long term Real GDP trend for the US economy as the world’s dominant market place and certainly recognized as the safest for investment capital for a variety of reasons including being the most liquid. I find that this view provides a relative rate of return benchmark that is helpful with which to identify market risk.
Methodology:
- The Real US GDP trend from 1930 is est, using regression analysis and the Dallas Fed’s 12mo Trimmed Mean PCE(Inflation Deflator) is added back to create the Market Cap. Rate. The series is limited by the fact that the 12mo Trimmed Mean PCE has not been researched earlier than 1978.
- The SP500’s mean earnings trend from 1940 is used to provide an estimated earnings yield using the current SP500 price.
I view the SP500 as undervalued when the SP500 ttm est Earning Yield is greater than the Market Cap. Rate.
My reason for selecting the Real GDP trend and the SP500’s mean earning’s trend is that the trends are better at providing historical perspective than taking the raw data at face value. Real GDP trend today is ~3.16% +/- 2.6%(roughly) while the trend of SP500 earnings the past 70yrs has been ~6.1% +/- 38%. The volatility in these trends taken at face value, which many do, makes market analysis very difficult and in my opinion nearly useless. The trends are much simpler to use by long term investors for whom this is developed.
The SP500 typically rises till the SP500 est Earnings Yield is 80%-85% of that demanded by the Market Cap Rate. This is the level from which 30%-40% corrections occur if investor expectation’s for earnings are disappointed. The influence of market psychology has been dramatic. This can be seen with the undervaluation of the early to mid-1980’s caused by the disbelief that the Fed would control inflation and then with the wild hopes of the Internet and low, low inflation in the late 1990’s driving markets to exuberant excess. I will leave it to you to calculate the overvaluation of the SP500 in March 2000 vs. Market Cap. Rate.
Today the SP500 est Earnings Yield is 6.24% as compared to the Market Cap Rate of 4.66%. The Market Cap Rate is in a down trend with falling core inflation. The SP500 has the potential to be (6.24%/4.66% = 1.337 or 134%) some 34% higher should recovery continue and earnings normalize. Using the SP500 Oct 2009 closing price of 1039.19 the potential SP500 is est at 1389.4. This value is only an estimate and it will likely change next month, but the direction and magnitude provide useful support for a positive stance at this time.
Because inflation is based on the Fed’s monetary policies, it is impossible to predict where the 12mo Trimmed mean PCE will be even a few months in the future much less 2yr-3yrs. The best that is possible is to track the current valuation levels with a goal of reducing risks as they become apparent.
Today the SP500 appears to be attractive.
My note: I have been on record saying I feel the market in general is “fairly valued” at the current earnings level. I also feel there is tremendous value in certain issues, if you are willing to dig for them. Being a “deep value” guy for lack of a better term, perhaps my “fair” is actually “slightly under” valued. It may depend on where you start from.
With all that being said, “Davidson” deserves our attention for his call in late March this year to go “all in”. When others were running scared, he dove in and was the first I saw at the time bucking the panic trend.
