Forget all the theories as to why the market keeps going higher, there really is only one reason. The fundamentals of our economy keep improving..
“Davidson” submits:
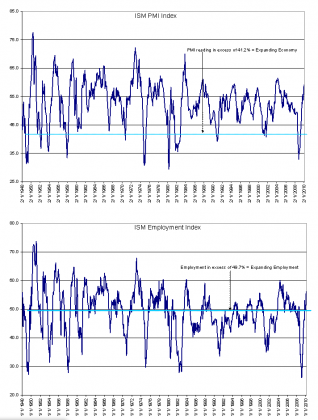
The Institute of Supply Managers Purchasing Managers Index reported the March 2010 survey this morning with a higher 59.6% vs. Feb’s 56.5%. The trend is positive with a value over 41.2% indicating an expanding economy. The index moved over this threshold in May 2009 with US GDP becoming positive in June-July 2009. The history of this survey as an economic indicator has been quite good as its history has developed since January 1948.
The PMI Employment Index remained solidly in positive territory at 55.1% vs. Feb’s 56.1%. A report over 49.7% indicates expanding employment. The PMI Employment Index first moved over this threshold in October 2009. Employment is crucial to economic recovery and appears to continue in a healthy trend.
I excerpted commentary I thought was important and provided the ISM PMI and PMI Employment Index charts below for reference. The press release may be accessed using the link provided.
Conditions remain very favorable for global equity at this time in my experience.
Excerpts:
PMI
“The report was issued today by Norbert J. Ore, CPSM, C.P.M., chair of the Institute for Supply Management™ Manufacturing Business Survey Committee.”The manufacturing sector grew for the eighth consecutive month during March. The rate of growth as indicated by the PMI is the fastest since July 2004. Both new orders and production rose above 60 percent this month, closing the first quarter with significant momentum going forward. Although the Employment Index decreased 1 percentage point to 55.1 percent from February’s reading of 56.1 percent, signs for employment in the sector continue to improve as the index registered a 10 percent month-over-month improvement, indicating that manufacturers are continuing to fill vacancies. The Inventories Index provided a surprise as it indicated growth for the first time following 46 months of liquidation — perhaps signaling manufacturers’ willingness to increase inventories based on expected levels of activity.”Employment
“ISM’s Employment Index registered 55.1 percent in March, which is 1 percentage point lower than the seasonally adjusted 56.1 percent reported in February. This is the fourth consecutive month of growth in manufacturing employment. An Employment Index above 49.8 percent, over time, is generally consistent with an increase in the Bureau of Labor Statistics (BLS) data on manufacturing employment.”
Also:
The Dallas Fed released their National Economic Update thru March 31, 2010 last week. The economic trends are positive in every arena considered. The major concern constantly expressed is that of employment. For data collectors and market watchers of weekly reports the overall picture remains unconvincing and they tend to overweight reported employment numbers. This is a mistake in my view! In the face of overwhelming improvements in so many parts of the economy that cannot occur unless there is substantial employment improvement, i.e. consumption at record levels, auto sales at 13mil ann. pace, inventories at historic low levels and numerous other indicators, there simply must be a higher level of employment than that which currently reported. The issue with employment reports is the delay in reporting figures which may be more than 1mo. But, this is only a small part of a much larger issue of obtaining accurate readings on which to make investment judgments.
Employment data is notorious in being what is called a “Lagging Indicator”. The final and most accurate figures for employment do not occur till 18mos after the weekly data has been released. The reason for this is that the weekly reports are estimates made with incredibly small samples which have been shown can vary significantly when tax returns some 18mos later have been analyzed. Most ignore the corrections to what was reported 18mos ago and do not realize that it just does not make sense to focus so intently on a weekly report with so much eventual correction. I think the reason for the investment world’s holding their collective breath for the employment report’s release is peer pressure and Attention Deficit Disorder(ADD). Sometimes I think it would be better for all if we maintained longer investment horizons. But on second thought, it is those investors who are subservient to peer pressure who sell low and buy high that makes the market attractive for us value investors, the Business Cycle Investor.
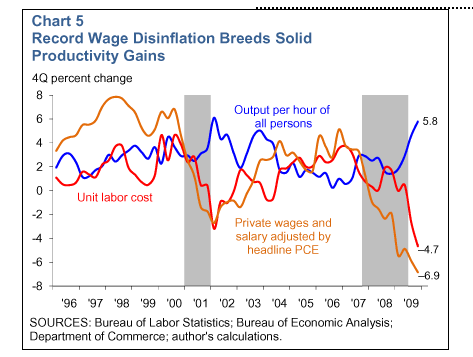
Charts 3&5 in the National Economic Update are intriguing. In Chart 3 the Temporary Help Index is just coming off the highest level since 1998. Temporary Help turns into Full Employment in the coming months with full benefits as the economic recovery continues. In Chart 5 the “Output per hour of all persons (working)” is at the highest levels since 1996. This level of output per person cannot be sustained due to increased defect rates, higher accident rates, worker tendency towards illness and other issues which in short order ramp employee costs higher to the point that it is cheaper to recall furloughed employees or hire new people.
This is a very favorable report for equity investors and this is the reason to pass it on to you.
March 31, 2010
Mixed Data Support a Moderate Recovery
Recent data point to a mild firming of the underlying pace of final demand growth. However, questions remain as to the sustainability of growth as conventional monetary and fiscal policy stimulus efforts fade over the course of this year. Improving trends in production and employment suggest that job losses might soon give way to modest gains. In light of continued debt deleveraging and tight credit conditions, persistent economic slack will likely continue to constrain inflationary pressures and expectations.
Strong Fourth Quarter GDP
In fourth quarter 2009, real gross domestic product (GDP) grew at a better-than-expected 5.6 percent seasonally adjusted annualized rate, the strongest quarterly growth in more than six years. The final estimate of fourth quarter GDP released by the Bureau of Economic Analysis showed that more than two-thirds of the quarter’s growth was attributable to less inventory liquidation. Consumer spending, net exports and business fixed investment were revised moderately weaker than originally estimated. Real final sales, which exclude inventories, grew 1.7 percent—1.4 percentage points from rising domestic demand and 0.3 percentage points from higher net exports. Real final sales has averaged less than 1.9 percent over the past two quarters, indicating that the underlying demand for goods and services is still rather tepid.
Financial Markets Normalizing
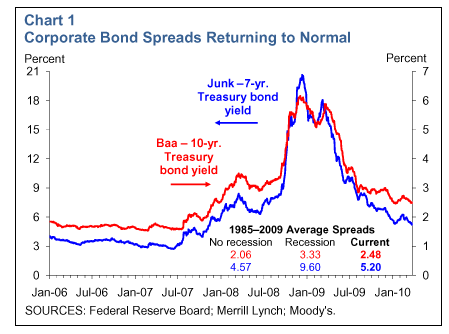
Contributing positively to the prospects for renewed economic growth, conditions in short-term and long-term funding markets have largely returned to normal. Moreover, the recent increase in the discount rate from 50 basis points to 75 basis points on Feb. 19 has not led to significantly tighter financial conditions; the move was largely accepted as a technical adjustment in response to improved financial market functioning. Market yields and related spreads for interbank lending, commercial paper, Treasury securities, corporate bonds and mortgages have attenuated over the past several months. Specifically, corporate bond spreads have recovered to levels seen in mid-2008, although the liquidity premium between Treasury securities and corporate bonds remains a little elevated from previous periods of market stability (Chart 1). Money market conditions have been well maintained despite the winding down of several Fed liquidity and asset programs.The process of normalizing the Fed’s function as a lender of last resort will proceed as money market strains continue to abate and the private sector reestablishes self-sustaining funding and liquidity.
Led by Manufacturing, Business Sector Improves
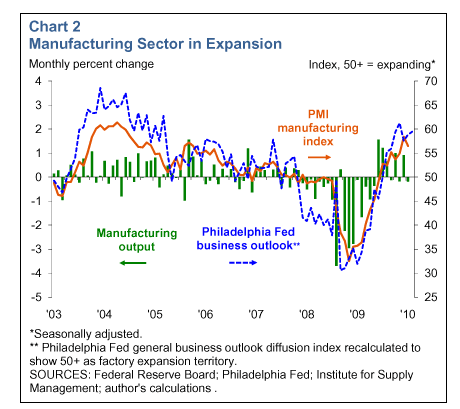
Total industrial production inched 0.1 percent higher in February following January’s solid 0.9 percent increase. Industrial production has been steadily improving since June of last year, and growth has been widespread. The Institute for Supply Management (ISM) composite manufacturing index indicated that the manufacturing sector continued to grow in February, although it showed some signs of deceleration as it declined 1.9 percentage points to 56.5 percent. Manufacturing output also declined in February, and manufacturing capacity utilization remains at a very low level at 69.4 percent. The Philadelphia Federal Reserve Bank’s general activity diffusion index, a broad measure of manufacturing conditions, further corroborates the strong rebound in manufacturing, with seven consecutive months of positive growth (Chart 2). The manufacturing sector appears to be expanding strongly from very low levels of resource slack.
Although experiencing less robust growth, the service sector also appears to be expanding. The ISM nonmanufacturing index rose 2.5 percentage points to 53 percent in February, indicating service sector growth for the second consecutive month. While the recovery remains modest, with forward-looking measures still below expansionary index levels, recent gains have been broader-based across the sector. Overall, business sector trends are encouraging for the labor market as the U.S. economy begins to rebound and soak up the economic slack legacy of the last two years.
Labor Market Still Weak but Poised for Positive Growth
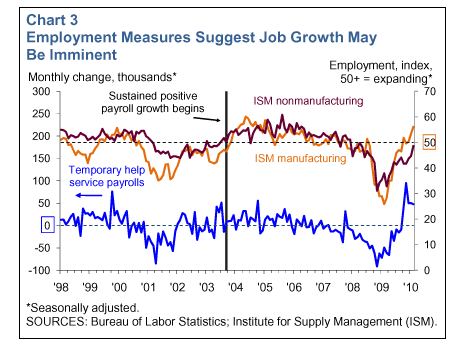
Labor market conditions are slowly improving, though unemployment remains mired at high levels. Initial jobless claims have trended only slightly lower so far this year, remaining above the approximate 400,000 claim level commonly associated with positive job growth. The February household labor survey continued January’s favorable direction as both the labor force and employment expanded for the second consecutive month, leaving the unemployment rate unchanged at 9.7 percent. February’s employment situation revealed nonfarm payroll employment fell by 36,000, noticeably better than the Bloomberg median forecast for a decline of 68,000 jobs. Serving as a possible harbinger of overall payroll gains, temporary help service payrolls have posted solid gains since October 2009, increasing an average 57,000 jobs each month. This payroll measure had been in positive territory for five consecutive months in 2003 before overall payroll employment began sustained positive growth later that year. Supporting an outlook for positive payroll gains in the next month or two are the ISM survey employment indexes, which have shown marked improvement over the past several months (Chart 3). Recent employment reports have been generally on the positive side, and the U.S job market may see a somewhat faster pace of job recovery in the quarters ahead.
Consumer Spending Edges Up, Although Households Remain Cautious
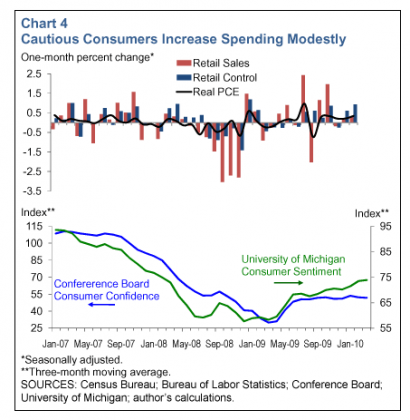
Over the past two months, the pace of consumer spending has improved from very low recessionary levels. Real personal consumption expenditures rose 0.3 percent in February, comparable to the growth realized throughout fourth quarter 2009. Similarly, nominal retail sales rose 0.3 percent, while retail control (retail sales excluding auto, gasoline station and building materials sales) rose 0.9 percent in February. However, recent measures of consumer confidence appear to be stalling out. The University of Michigan’s index of consumer sentiment remained unchanged in March, and the Conference Board’s index of consumer confidence rose 6.1 points in March after plunging 10.1 points in February. Overall, consumer confidence levels have not changed significantly since last summer, as the three-month moving averages of both indexes suggest that consumers cautiously await better employment and income trends (Chart 4). Given the guarded outlook and modest improvement in spending trends, the pace of real consumer spending suggests a moderate overall path to growth compared with previously robust, consumer-led recoveries.
Although the housing market has stabilized some in recent months, conditions appear fragile. As the extended expiration date of the first-time homebuyer tax credit approaches, the housing supply overhang resulting from slow demand, overbuilding and a large inventory of foreclosed homes remains a drag on construction spending and household net worth. In part hurt by unusually bad weather in February, housing starts declined 5.9 percent and were joined by a 1.6 percent decline in the housing permit series. Both of these home construction measures remain at very low levels—about 73 percent from their respective January 2006 peaks. Further evidence of the vulnerability of the housing rebound to future negative payback effects has been seen in the continued decline of new- and existing-home sales, which fell 2.2 percent to a record low and 0.6 percent, respectively, in February.
Price Pressures Remain Well Contained
While the manufacturing sector has begun to exhibit strong growth trends, disinflationary producer price tendencies remain in place due to the still-low level of manufacturing activity. Furthermore, recent data indicate continued downward pressure on consumer price inflation. Core consumer prices edged up only 0.1 percent in February, decelerating to a 0.1 percent annual rate over the past three months, and are only 1.3 percent above year-ago levels. Robust core measures like the Dallas Fed Trimmed Mean PCE and Cleveland Fed Median CPI have shown continued deceleration to all-time lows on six- and 12-month bases. Household deleveraging in the face of still weak housing and labor markets has helped push labor costs and wages to record lows while prodding productivity higher over the past several quarters (Chart 5). Therefore, in addition to disinflationary pressures from domestic slack, the economy is seeing little upward pressure from wages on overall inflation.
Upside Optimism Tempered by Persistent Downside Risks
Since the January FOMC meeting, financial headwinds continued to subside, the manufacturing sector expanded further and the service sector started picking up. Although economic activity has improved since dire times a year ago, downside risks to robust growth persist as extraordinary labor market and resource slack remain to be worked off in the wake of the recent financial crisis and severe recession. In particular, sluggish employment conditions, low levels of income growth and a slow housing recovery will continue to make it very difficult for consumers to simultaneously increase spending and pay down their substantial debt overhang. As the temporary impetus from the inventory cycle and the effects of federal stimulus wane, the onus of sustained economic growth depends on established job growth and strong private sector demand. Positively, with inflation expectations and pressures well contained thus far, the nation may yet see upside risks to growth from productivity, consumer spending and business sector expansion.
—David Luttrell
About the Author
Luttrell is a research assistant in the Research Department at the Federal Reserve Bank of Dallas.
