“Davidson” submits:
The Dow Jones Instustrial Average rose above $14,000 last week. To some this new high means higher prices ahead and to others it is reason to sell. Price as a measure of performance or what something is worth has been a 60yr frustration. Price is what many on Wall Street and is what academia teaches is the means to value the market. My approach is much more steeped in fundamental economic returns!
Price can be shown to be a measure more of market psychology than a measure of true valuation. Believing that price when compared to price history tells one something about the relative value of something misses entirely information concerning economic return. One first must have a measure of economic return and then apply it across market history to test its usefulness/reliability. This is the approach I have taken with the Prevailing Rate(a measure of market return) and SP500 Intrinsic Value Index(the price of the SP500 calculated from earnings returns capitalized by the Prevailing Rate). When one does this one can identify when the SP500 appears fairly valued and when it is not.
Any guesses as to how often the SP500 ($SPY) is fairly valued?
Using the SP500 Intrinsic Value Index one comes to the conclusion that the SP500 is fairly valued about 1% of the time(perhaps less).
When is the SP500 closer to fair value?
SP500 is near or at fair value only during market bottoms. Most of the time since 1995 the market has been grossly overvalued by investors chasing price trends, i.e. Momentum Investors.
What is the value of the SP500 Intrinsic Value Index today?
$1,737!! Or today’s SP500 is 14.8% underpriced.
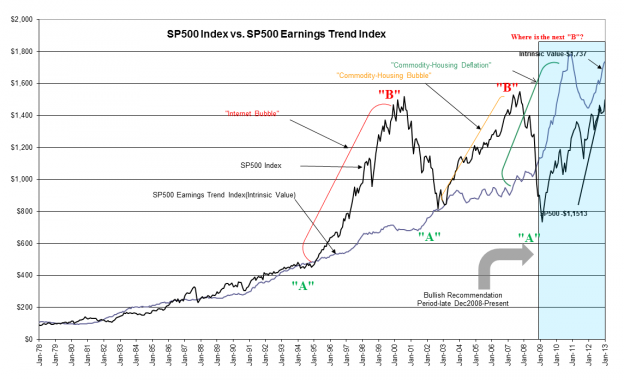
It should come as no surprise that markets are driven by considerable market psychology. The current chart of the SP500 vs. SP500 Intrinsic Value Index is shown below. The inflation measure used in the calculation is the Dallas Fed’s 12mo Trimmed Mean PCE and spans 1978 to Present. It is deemed a more reliable measure of inflation than its predecessors and is the reason the chart does not go back further than 1978.
The SP500 Intrinsic Value index is based on economic return. Since 1995 it has been very useful to be able to differentiate between what is a fair economically based price and what is a price based on market psychology. It is in 1995 when the visible effect of Hedge Fund momentum investing began to so influence market prices. We have had two major market rises and collapses. Rises well in excess of fair value occurred in 2000 and 2007. Each subsequent collapse returned to fair value! The pattern causes on to ask what caused the rises and why did fair value prove to be a rough market low. The answer comes from extensive reading of the many investors who comprise markets.
It is the value buyers of the likes of Warren Buffett who recognize economic returns who become the active buyers whenever the SP500 comes near the SP500 Intrinsic Value Index. It is these investors who cause markets to form lows eventually turning higher. What Buffett does is to buy a stream of future expected returns(he uses a mental average) in the context of a similar stream of returns generally available in the economy(Real GDP + Inflation). This is a simple rate of return comparison. What is not simple is the fact that Warren does this all in his head and has never explained it as I just have.
Every other investor falls into the camp of momentum traders. It is these investors who believe in “The Efficient Market” and “The Invisible Hand” and buy and sell stocks based on the current stream of economic, geopolitical and taxation news. They are “News Investors”. If the news is good, they buy? If the news is bad, they sell! They believe that the market correctly prices all securities all the time and incorporates all the information that can be known instantly into price. Basically, the market is composed of 2 types of investors, a very few value investors like Warren Buffett (who I believe make up about 1% of all investors) and the rest who seek to imitate the trades of the 1% and the momentum traders who trade on price changes. Warren Buffett does not believe any of this and has written extensively over the years as to why his approach differs, yet Warren has never explicitly explained exactly what it is that he does. My guess is it is precisely because he does all of it in his head, knows what to do, but can’t articulate it. He sees it as one huge theme, somewhat like Einstein doing math by mixing colors in his head. Genius is like this!
So….How high is “High”?
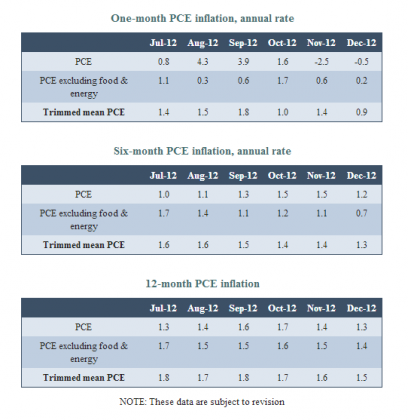
The Dallas Fed reported their inflation measure 12mp Trimmed Mean PCE at 1.5%-see the table below. One-month and six-month suggest that inflation is tracking yet lower in coming reports. This results in a Prevailing Rate of 4.52%. Capitalizing the mean SP500 Earnings Trend produces an estimate of the SP500 Intrinsic Value of $1737. The importance of the SP500 Intrinsic Value is that this has been the buying level of deep value investors at market lows since 1978. With the SP500 at $1,513 today it is ~14.8% less than the level usually representing market lows since 1978. Lower inflation justifies stocks at higher prices. Historically this has always been the relationship between stocks and inflation. As investor confidence improves we should expect the same in coming years.
Considering the many negative market views still expressed daily, one comes to the conclusion that the market remains undervalued as investors remain overly pessimistic. This should change in the months ahead as home and commercial construction building activity increases.
Estimating how high the market can go is much like me predicting how you are going to feel next week or next year at a particular date. Even though it is impossible to predict the elements of market psychology, we can still use the past to roughly gauge what can happen if there is a repeat. If we extend the SP500 Mean Earnings Trend 5yrs into the future we will get $105.50(remember: this is the mean trend not peak nor bottom earnings that is used in this calculation). If the current Prevailing Rate of 4.5% is applied, a SP500 Intrinsic Value Index calculates to $2,344. If Momentum Investors repeat their past behavior, then a 50% excess or higher can occur. A 50% excess calculates to ~$3,500. This looks like a silly number, but we have had a similar excess in our recent past and being really silly about chasing markets is likely to occur again. We will not know till we see how the Momentum Investors respond to the “good news” when the economy is in excess.
How does one handle this? One learns that Momentum Investors trade the “news”. If one tracks the economic trends, then one can roughly predict within 12mos when the economy is likely to generate good or bad news. Couple this information to the SP500 Intrinsic Value Index, one then can identify when the market is in or near its lows and later in or near its highs. The time difference between economically generated market lows and highs has been 6yrs+. One cannot predict this with precision, but one can monitor it closely and be within 12mos for lows and highs. Just capturing most of the upwards portion of stock market activity during economic recovery/expansion/excess and side-stepping a portion of the correction can have a substantial benefit if one has the tools to do so.
While I do not believe one can predict “How high is HIGH!”, I think the tools are there to let one monitor the big picture and take the appropriate action.


2 replies on “S&P 500 Intrinsic Value Update”
[…] By: valueplays […]
[…] 500 Intrinsic Value Update at Value Plays. Yet the theory remains the current secular stock bear still needs depressed […]