“Davidson” submits:
As if on cue, the Monthly Supply of Homes for Sale was reported at 4.1mos, a very strong indication of housing demand. Investors who panicked on Bernanke’s comments yesterday have been forced to rethink their equity sell decisions. As I write this note, the market has mostly regained the sharp sell off this morning.
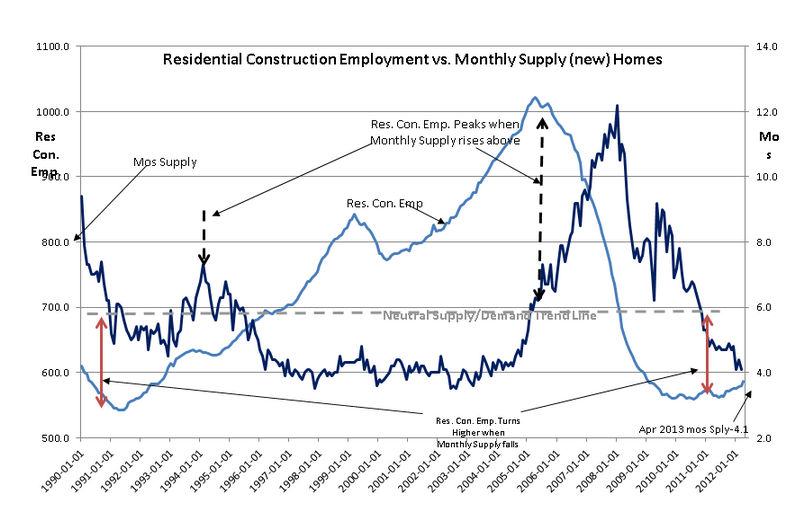
The Monthly Supply of New Homes is a dynamic calculation, New Home Inventory/Last Month’s Sales, and provides a very good indication of housing demand, ease of financing purchases and direction of the Residential Construction Employment trend. In the chart below one can see that there is a strong correlation between the Monthly Supply and the future employment trend. The Monthly Supply below ~6mos is very positive for increases in Residential Construction Employment leading the employment trend by ~12mos. A monthly supply of 4.1mos indicates that hiring in the housing industry should be strong 12 months ahead which should continue the pace (or expand) the pace of economic expansion of the past 4yrs.
Because housing and commercial construction are financed and have such a wide ranging effect on many industries, the impact on our economy is significant. Only now are we beginning to make-up for the unsatisfied demand of the past 5yrs. Economic history suggests that a 5yr-6yr expansion in the construction cycle is still ahead of us.
Stock markets are driven higher by expanding employment and economic activity.
My commentary:
Now plenty of people think we may be in another “housing bubble” or think this cannot last. They will point to “real incomes down 3% since 2007” and *new* home prices at an all time high as an indication that the market is at a top or an unsustainable point. This is flawed thinking and here is why:
1- Household formation. The household demographics of $50k -$100k in income are ~30% of all households. Since ’07 that groups has seen a “real” income (accounting for inflation) decline of ~3%. Now, we add ~1M new households to the US each year meaning since 2007 there are 1.5M more households in that group. So, while the group’s gross income may have fallen slightly vs inflation, its collective buying power is far stronger due to the growth of the group.
2- Is it gross income all that matters? No. What matters more is your disposable income. The massive deleveraging consumers have undergone since 2008 has left their balance sheets in the best shape in a very long time. Consumer debt service as a percent of disposable income is at its lowest level since the series began in 1980
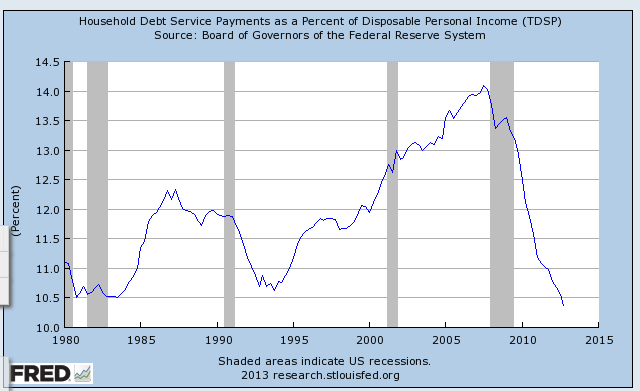
If we look at that chart and overlay a chart of new home prices vs disposable income we see the current state of the new home market is nothing out of the ordinary. The sharp rise we have seen is simply prices reverting to a more normalized relationship to disposable income
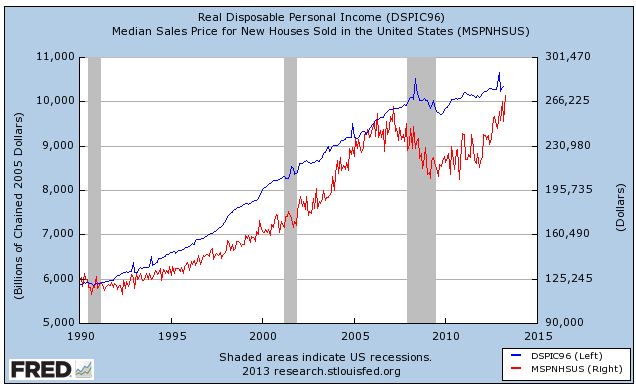
Let’s go back to number 1, the “real” income decline. Now while the largest home buying demographic may have seen “real income” fall slightly from 2007 to 2012, the “real disposable income” has risen. Since disposable income is what is used to buy a home, that provides this group even more buying power than the organic growth in the size of it did.
3- Lending remains VERY tight. Check out this article from the LA Times. 35% down for a subprime loan vs the no money down Alt-A loans from 2005-06 ($2T of them). This is a very safe loan. If they fall behind they have 35% equity in the home, they can sell it and get out. The Temecula market has seen housing prices growth from $200k to near $300k since 200p (still down from $429k in 2006) so prices there are stable which buffers the loan further. I would argue this loan is a bit ridiculous in its terms (too strict) but again, it goes to the claim lending is excessively tight now.
As rates rise (not spike, just rise a bit) you see more reasonable terms for these folks and more buyers come into the market (not for new homes necessarily but for resale). Why? A bank getting 4.5% on prime loans vs 3.5% can then pass some of that onto other buyers. There is nothing wrong with a subprime loan, as long as the bank is adequately compensated and require prudent collateral. They are doing more than that now.
Bottom line? We are nowhere near a “top” in housing and the consumer has the balance sheet to buy plenty more homes. Price have risen on new homes so much due to the extreme dearth of supply. As supply catches up (prob 1-2yrs) we should see price appreciation wane. Now, this does not mean housing collapses it just means the 5% monthly price increases return to more normal 4-6% annual ones. Transaction volume will remain high (due to the factors above) as the growing home building market adds more jobs and higher incomes to the overall economy.
One reply on “Housing Thoughts & New Home Supply Sinks to 4.1mos”
[…] if you follow new home starts and auto sales you’ll know that as long as they are rising, employment will not fall. They […]