This piggybacks on my post from last week:
“Davidson” submits:
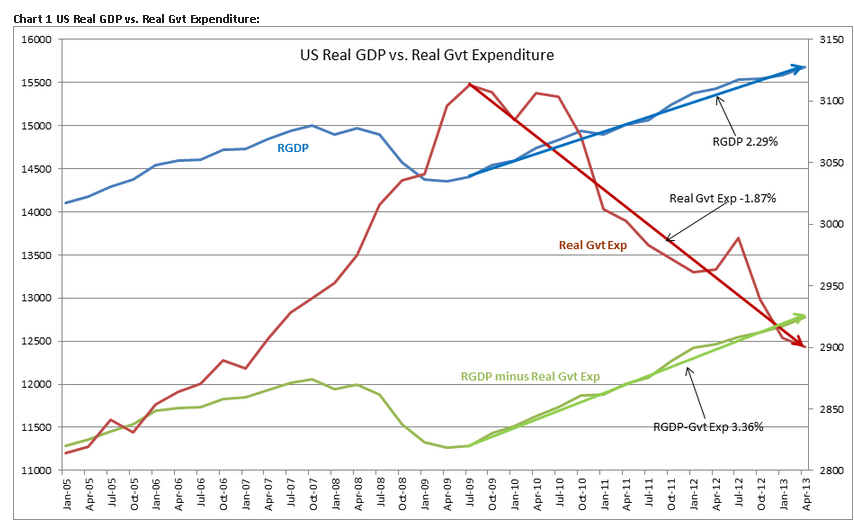
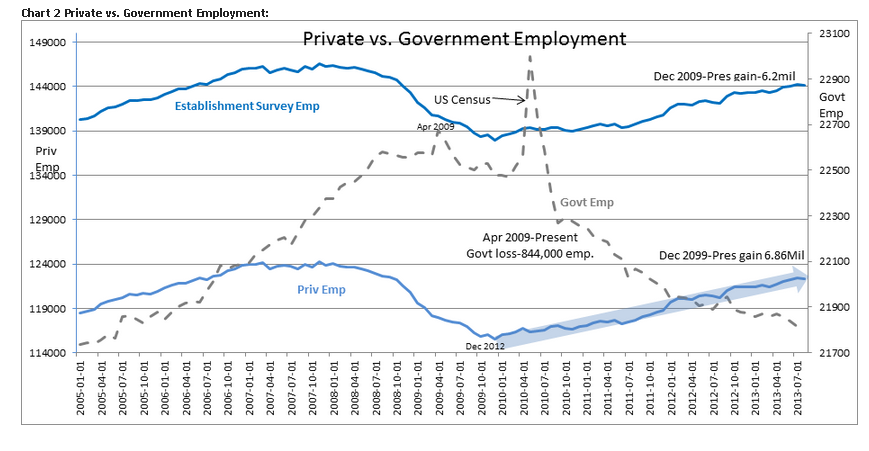
Thinking that things are better than most believe they are is dependent on how one looks at the available data. I am optimistic because I see the Private Economy Sector overcoming the drag coming from the Government Sector. To explain this I call your attention to the 2 charts below, Chart 1: US Real GDP vs. Real Gvt Expenditure & Chart 2: Private vs. Government Employment.
The US economy is measured using GDP(Gross Domestic Product) and when adjusted for inflation we use Real GDP. The formula used in calculating GDP is:
GDP = private consumption + gross investment + government spending + (exports − imports)
By subtracting out Government Expenditure one can isolate the Private from the Government additions to our total GDP and adjusting for inflation gives us Real GDP and Real Govt Expenditure(Spending). Adjusting for inflation provides us with a means of viewing today’s levels within the proper perspective the levels of the past and identifying trends. Even though Real GDP is the common measure used to track economic activity, it is very important to note that it is ONLY the Private Sector which is represented in the equity markets. Many do not make this distinction. Let’s look at the Private Sector vs. the Government Sector!
In today’s environment there are many investors who remain pessimistic because stock prices have appreciated while Real GDP has not recovered to historical levels. The US historical Real GDP trend the past ~20yrs has been ~3.1%(not shown). Many view the current Real GDP as lower than the 2.29% annual trend I have measured in Chart 1. The media often frets that the stock markets are over-priced and primed for correction because equities are trading at historic P/E(Price/Earnings) levels while the Real GDP trend is well below normal. They state that it is only market euphoria in response to the actions of the Federal Reserve and not fundamentals which have driven stock prices higher in speculative frenzy. This view is repeated daily by the media and coupled to a slower rate of growth in employment than seen historically. My observations come to the opposite conclusions.
When one analyzes Real GDP, Private and Government Sectors separately one sees divergent trends. Real Government Expenditure has been falling at -1.88% rate since April 2009-Chart 1. This leaves Real GDP for the Private Sector by itself(RGDP minus Real Gvt EXP) growing at 3.36%-Chart 1. This pace is quite a bit better than the less than 2% some of the pessimists are using today. Net/net the Private Sector is growing while experiencing a significant decline in Government Expenditure. This is quite positive for equity investors as it shows that the Private Sector is growing independently of Government contraction. Stocks have a good reason for being higher!
Slowing Government Expenditure is reflected in overall employment measures, Chart 2. Government has lost 844,000 from the peak in April 2009(this ignores the temporary Census employment spike of May 2010) while the Private Sector has added 6.86mil to the employment rolls from the low of Dec 2009. We would like to see more employment, but this is a decent increase. Higher employment is expected as the housing market continues its expansion.
This analysis reveals that the US economy is in better good shape than what has been commonly in the media and is expanding reasonably well. The shrinkage in Government hides the strengths of the Private economy. At some point government shrinkage will stabilize and the apparent drag on RGDP will diminish. When this occurs RGDP should rise more in line with historical trends and we should benefit from improved market psychology.
Trends in the Private Sector RGDP favor higher equity prices ($SPY). Optimism continues warranted!