I got a question for Davidson the other day. The basis of it was the discrepancy between Davidson’s claims that the market is still cheap and ripe for investment and Robert Schiller’s PE levels that indicate the market, based on historic levels is over priced (current PE of 19 vs 16 historical avg).
“Davidson” responds
Markets should be viewed as a human system in my opinion. We use them to exchange the value of our production/labor which has an ebb and flow on multiple levels some seasonal as in housing, some having active growth periods which are one-offs as the Internet growth of the 1990s and so on. The system is always in flux as is how we value what something is worth. Mixed into this variable potpourri are various self-professed ‘experts’ touting their services for a fee, some are called Value Investors and some call themselves Growth Investors and then there are Hedge Fund investors. The points of view are so many that it is fair to say no two views are the same and in vying for business to Value Investors can be very close in style yet they can bash the other’s style as ‘very different’. Much of what we hear is to place one in front of what appears to the largest audience to win the most investment capital and expand one’s fees. Caught in the middle of all this noise there is something much closer to the truth. If one studies Warren Buffett’s writings and investments, compares his activity to that of Wilbur Ross, Bruce Berkowitz and several others you can begin to see the patterns which lead to being an independent investment thinker. The truth as it can best be understood is what my work is about as told in 4 charts.
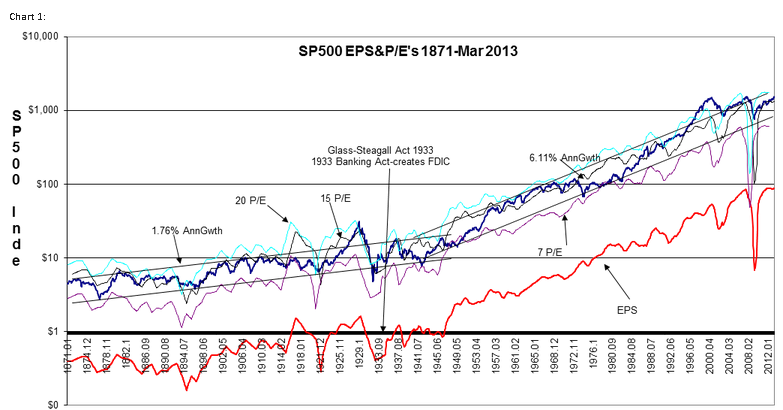
Top chart shows Robert Shiller’s market re-creation back to 1871 of SP500-Chart 1. That we are a human system with humanly defined rules is clear by what occurred in 1933. The modern market came to being not with Glass-Steagall but with FDIC, in my opinion. FDIC stopped the extreme losses which occurred periodically with financial crises during which individuals not only lost their savings but lost their homes when their banks failed. Regulation really has not prevented bank failure, but FDIC since 1933 meant that individual life efforts were not turned to dust when 1) savings were guaranteed and switched to another financial inst and 2) mtgs and loans were not called in the middle of a financial crisis. Individuals who had savings could outlast financial crises and come out the other side still partially whole if they maintained loan payments. FDIC totally changed our economy!! Since 1933 the rules permitted the middle class to survive and grow during each crisis from a level while lower than the high they had reached during the peak it was higher than the low of the last cycle. Got it-higher level of lows from 1933 onwards for middle class financial worth! The typical cycle prior to 1933 when those with wealth bought up the assets of failed banks including many individual properties stopped the transfer of wealth to the wealthiest during financial crises. The FDIC savings insurance was a financial rule change which permitted a middle class to accumulate wealth and stocks which prior to 1933 show an earnings pace of 1.76% began to display a 6.1% pace after FDIC was implemented.
Once one begins to see that we are always trying to set/reset the rules of value exchange to ensure ‘fairness’, one will quickly come to understand that pre-1933 financial measures cannot be averaged with post 1933 measures because 1933 was a major change of the rules of exchange.
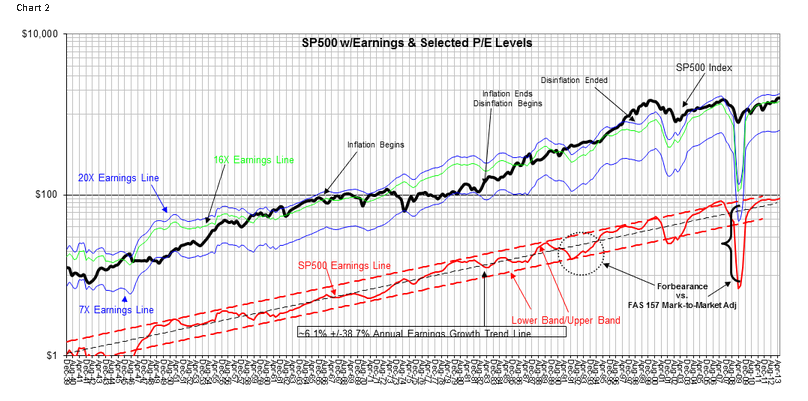
Certainly using P/E to measure has been popular and some use 50yr averages and etc to compare to today’s levels. But, again one cannot do this! P/Es vary with inflation & long term Real GDP. Knut Wicksell in 1898 postulated that all investment returns were priced based on what the returns were in the general economy, but not necessarily across a single economic/investment cycle. This means that one must identify the rate in the general economy which includes an inflation component and use this to capitalize returns. One gets there using the longer term trend of Real GDP-easy to measure-and by adding back into it the best known inflation measure-this is the Dallas Fed 12mo Trimmed Mean PCE. Rather than call this after Wicksell’s ‘Natural rate’, I call it the ‘Prevailing Rate’. The ‘return’ for the SP500 is the long term mean earnings trend as shown in the Chart 2. Notice how uniform SP500 earning have been since 1940-a straight line means consistent rate of return for the period on a semi-log chart. The uniformity lets us project SP500 mean earnings forward at least 5yrs because we have more than 70yrs of economic/political/global history and the US has performed throughout the period at the same pace. What has changed is the P/E.
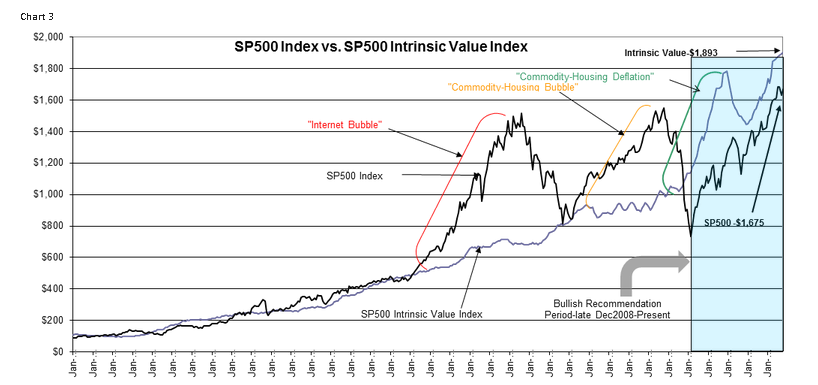
How high or low a market is priced using P/E is dependent on inflation and Real GDP or the Prevailing Rate at the time. This is why the P/E levels of the market are shown in Charts 1&2. The low P/Es of 1970s into 1980s was due to high levels of inflation. This was caused by The Great Society spending. Many will use averaged P/Es, but you miss the details impacting the markets if one does this AND make errors in pricing the market. Best to understand what is ‘fair pricing’ using the current Prevailing Rate and SP500 mean earnings. Chart 3 takes the SP500 mean earnings and capitalizes the value by the Prevailing Rate. Today the Prevailing Rate is 4.3009%, Real GDP growth trend is 3.009% and inflation is 1.3%. Divide this into the earnings trend of $82.015 and one gets $1,893 for the SP500 Intrinsic Value Index. The SP500 remains under valued vs the SP500 Intrinsic Value Index today.
If one develops profiles on the investment behavior and commentary of the very good Value Investors, i.e. Warren Buffet, Wilbur Ross, John Castle and others, one can see that they are buying stocks when the SP500 is below the SP500 Intrinsic Value Index. The extensive study about top Value Investors lets one reverse engineer what it is they use as a benchmark. They have never expressed that this is their benchmark, but they analyze investments much like we put one foot in front of the other. It is inherently a natural process for them. Buffett can recall detailed financial statements from 40+yrs ago and he never uses a computer for his investment judgment. He says his “…brain is a computer.” He is that unusual.
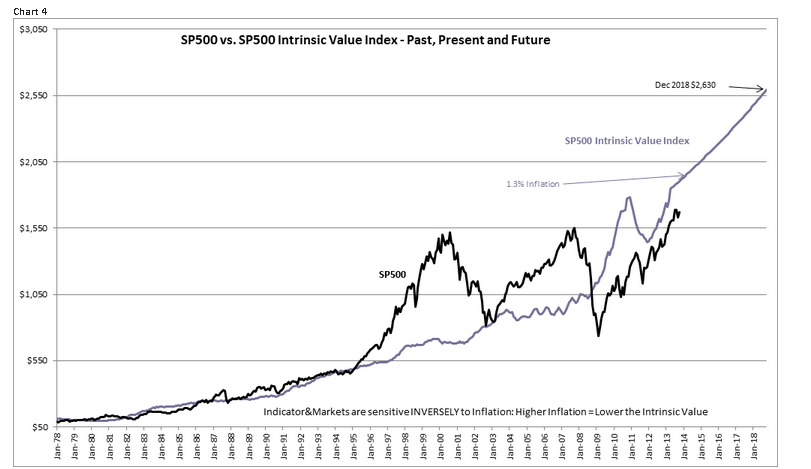
Chart 4 extends the SP500 Intrinsic Value Index to Dec 2018 when I think it is likely we could see the economy peak. Not being able to predict inflation that far out, the 12mo Trimmed Mean PCE is only good for 12mo ahead, I simply use the current level to provide a ballpark SP500. If inflation rises, then the level would calculate lower, but the market does not pay much attention to inflation adjusted SP500 valuations till it bottoms in recession. The major market lows are made by Buffett and other Value Investors who buy for the long term earnings trend within the context of the current Prevailing Rate. Got it??
The markets have basically two valuation schemes:
1) Value Investors buy for forward earnings in the context of the Prevailing Rate.
2) Momentum Investors who buy/sell based on the headline news.
The Value Investors who make up about 1% or less cause the markets to bottom in recessions. The Momentum/Price Trend Investors play the news and drive the markets to excess at top/bottoms. It is the Value Investor buying which sets the price trends that the Momentum Investors follow. Value Investors read the economy and business values. Momentum Investors believe this to be impossible an simply monitor market behavior and headlines. It is the Momentum Investor who drives markets to excess and makes predicting future prices impossible. It is the Momentum Investors who believe their mathematical models actually provide them with insight.
To repeat what this means, market prices are created mostly by Value Investors at the major lows and by Momentum Investors at the major highs. Inflation is only a market factor when Value Investors factor it in at market lows. Between market highs and lows, inflation can change quite a bit and investors ignore it.
The recent low in March 2009 was due to FAS 157 causing many investors to factor market prices of bank bond portfolios and etc into changes in Book Value or Shareholder Equity. But, investors were selling securities off with reckless abandon and the long term economic values were well above what were being posted as BV. This threw many banks into having far less equity than regulations permitted and they were headed to immediate bankruptcy till Bernanke said in testimony before Congress that we should ignore FAS 157. The market turned up that day!! You can see in Chart 2 that eps plunged like it had never before and then returned just as quickly. This was the impact of writing off BV and then writing it back on as prices improved which they did fairly quickly.
Markets are human systems. Mathematical precision is a non sequitur. Rules change the markets react and future behavior can be unpredictable as FAS 157(Mark-to-Market) showed and as did eliminating the ‘Up-Tick Rule”.
But, if one views the markets within the context of being a human system, one can make enough sense of it to be much more like Buffett in investment returns.
Buffett alludes to this in this video. If the Schiller PE of 23 vs 16avg were accurate, he would not be making this claim:
My issue with the Schiller PE is its own chart:
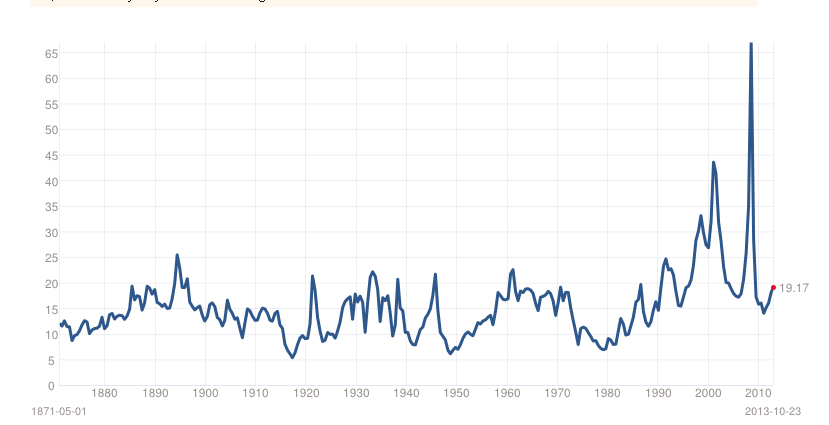
According to the Schiller PE, at the market lows in 2009, the S%P was “over priced” (Schiller PE of 70) based on historical values and in no way a bargain. I think most people would have a hard time rectifying that. Further if we look at Davidson’s Intrinsic Value index, we see in the spring of 2009 the S&P ($SPY) was dramatically below its intrinsic value and a stunning buying opportunity. The rally we have seen since would back that.