“Davidson” submits:
The media has for sometime covered the subject of individuals leaving the workforce. The term most often used is ‘discouraged workers’ and with this comes blame for the political party in office. The issue is really far less politically charged and more dependent on demographics. Have you ever heard of the term “Baby Boomer”?
Baby Boomers is my age group and represents the uptrend in births which had been postponed during WW2II society experienced from 1945 to the early 1950s. In 2005, some 60yrs later, this group of individuals began to retire and collect Social Security. Arriving at the precise impact on the Household Survey which is the broadest employment measure is not possible, but one can come to some conclusions which are supported by the charts I show below.
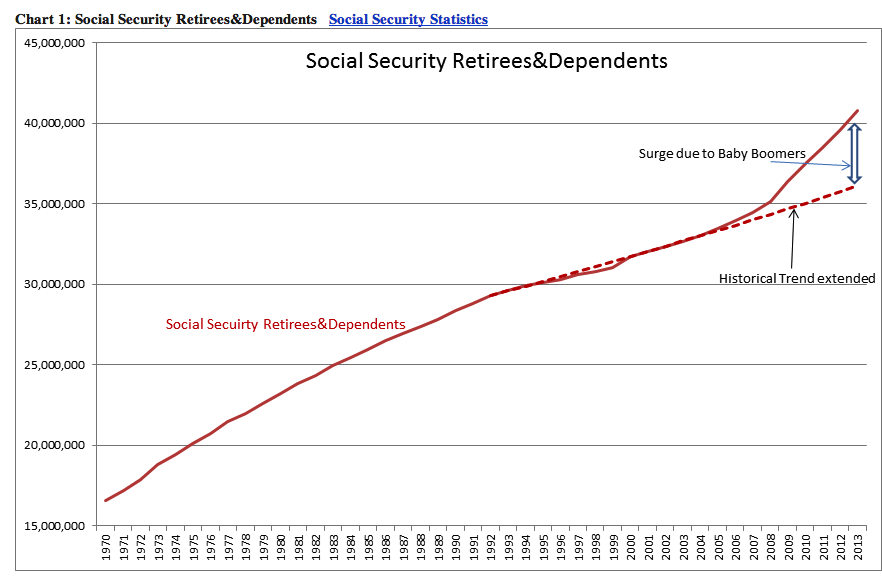
Chart 1: Social Security Retirees&Dependents shows the level of Social Security(SS) Retirees&Dependents from 1970 as shown by the RUST COLORED LINE. You can observe that the trend as shown by the RUST COLORED DASHED LINE changed dramatically after 2004 as those born just after 1945 reached retirement age and became Social Security beneficiaries. This surge of beneficiaries represents just under 5mil more individuals at the end of 2013 than the historical trend prior predicts. This is a rough measure as all of those receiving SS Benefits have not necessarily retired entirely from the workforce. But, it is the best measure we have available and in Chart 2 this adjustment has been applied to the Household Survey Employment measure.
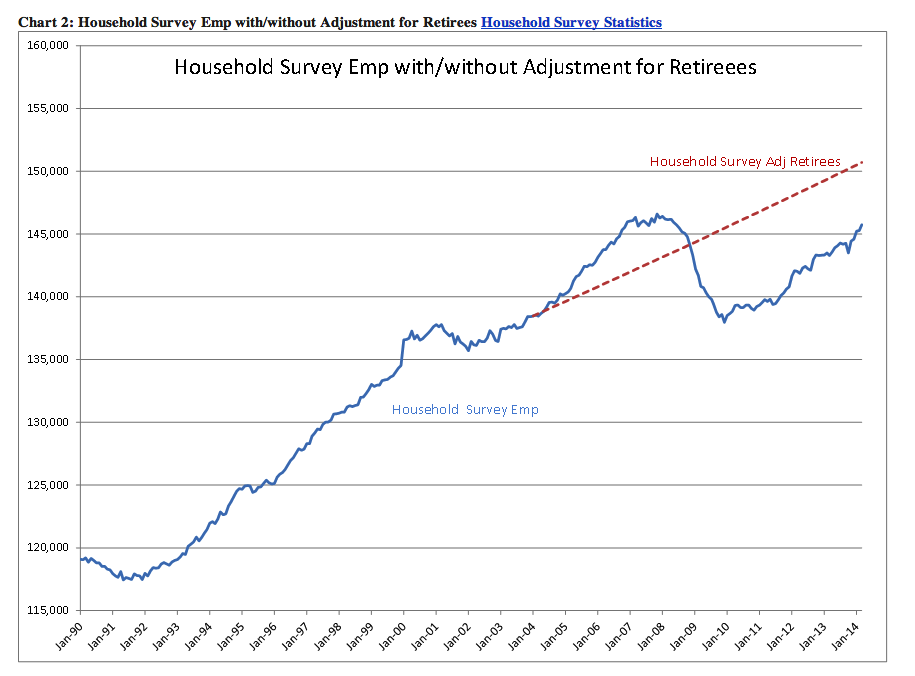
Chart 2: Household Survey Emp with/without Adjustment for Retirees shows that by adding back in all those receiving SS benefits(assuming that they are retired) would show a much higher level of employment, RUST COLORED DASHED LINE, than we actually measure and would greatly ease the concerns of many who worry about discouraged workers.
Not shown here is the rise in those who collect disability benefits which has gone from ~4.2mil in 1990 to ~11mil +today or rising from ~10% of all beneficiaries to ~19% +today. There is little detail for this data, but represents an increase of close to 5.2mil individuals currently who one might expect to have otherwise been employed.
Net/net our society has seen ~10mil individuals leave the workforce vs. prior trends which can be accounted for by retirement and disability. Even recognizing that this is a rough count of the current situation, this means we should adjust our thinking about employment rates by ~10mil than what seems to be the norm these days. The accepted wisdom has tended to call this decline in the workforce as attributable to “Discouraged Workers”.
There is a tendency for many in society to miss the details which comprise the broad trends. We make many errors in our thinking when we do this. Talking about “Discouraged Workers” and not including those who receive retirement and disability benefits is a disservice to us all
Our economy continues to expand. Housing and construction have yet several years of recovery with the associated impact on employment and their additional inputs to economic expansion.
The economy remains quite positive and not nearly as bad as many would have us think.