So, on the surface it looks as though total N. American rail traffic continues to lag behind 2014, potentially indicating a slowing of the economy. However, quick look beneath the surface should put those fears to rest. The top number looks as though we are running about 5k-10k carload per week behind last year:
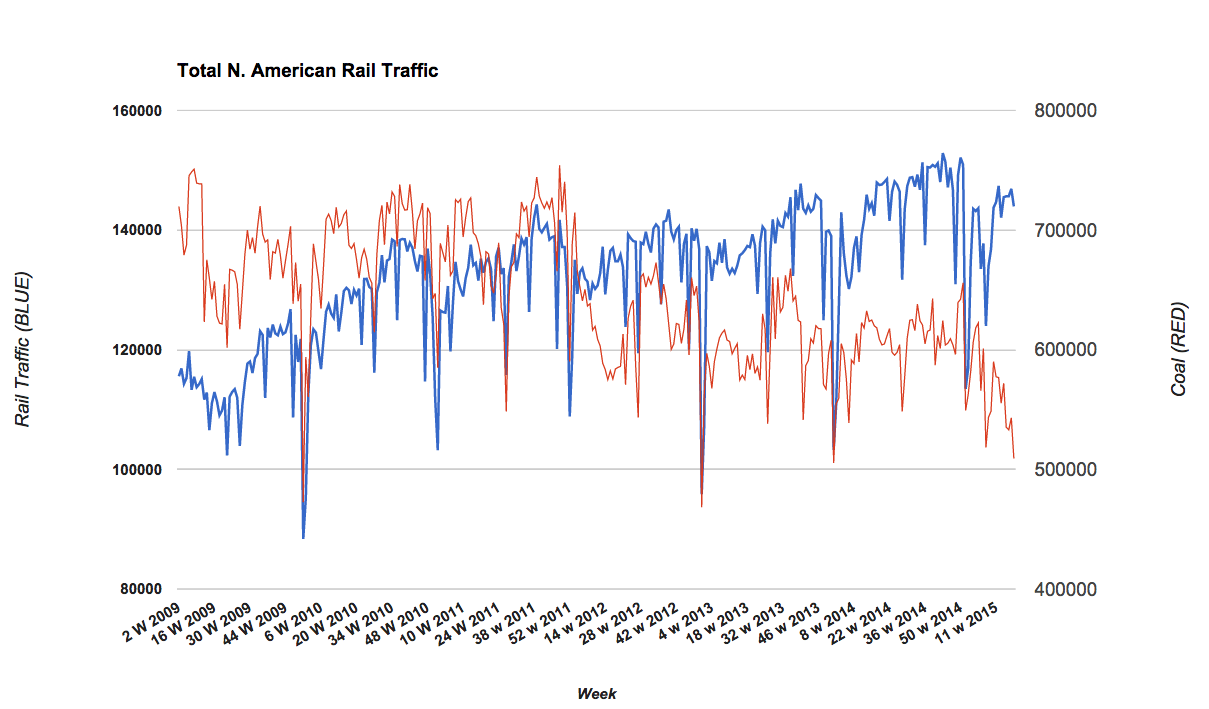
Note the following chart. We have seen a total collapse in the growth of petroleum shipments via rail (yellow line). I will also saw the # has fallen as the category is “chemicals and petroleum” and chemical shipments are still rising YTD so in order for this to remain flat, petroleum has to be falling.
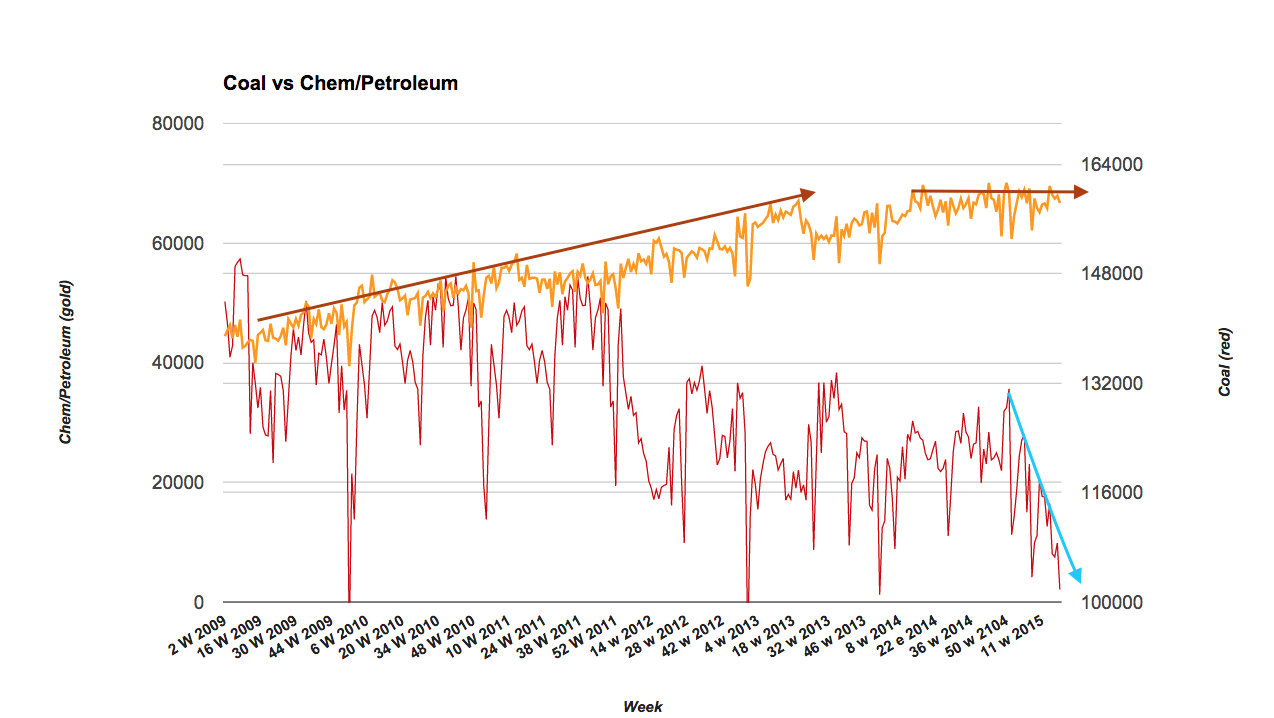
Also pay attention to coal (red line). It has taken another nose dive down (~20k carloads per week YOY) as utilities continue to make the switch from coal to natural gas (shipped via pipeline) for the production of electricity.
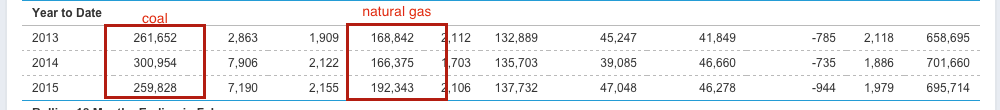
The shift in energy shipments due to the change in production feedstock is skewing numbers yet again. If we normalize the numbers, rail traffic is showing comfortable YOY growth. Below is the YTD data from the EIA (only Jan/Feb available) showing that while electrical production YOY is basically flat, there are significant changes in the coal/nat gas production mix ($UNG) ($COAL):
Intermodal and auto shipments remain elevated over 2014 (intermodal significantly so). Both of those go to the core of manufacturing/services and overall economic health in the US.
What to think? We remain on track for continued growth here in the US. Couple this data with the continually improving jobs data we see and it is clear the US economy continues to grow.