“Davidson ” submits:
Robert Shiller, Nobel Prize recipient and Prof at Yale University, presents the history of the US markets from January 1871-May 2015 in his ‘Irrational Exuberance’ on his website http://www.irrationalexuberance.com/main.html?src=%2F#4,0
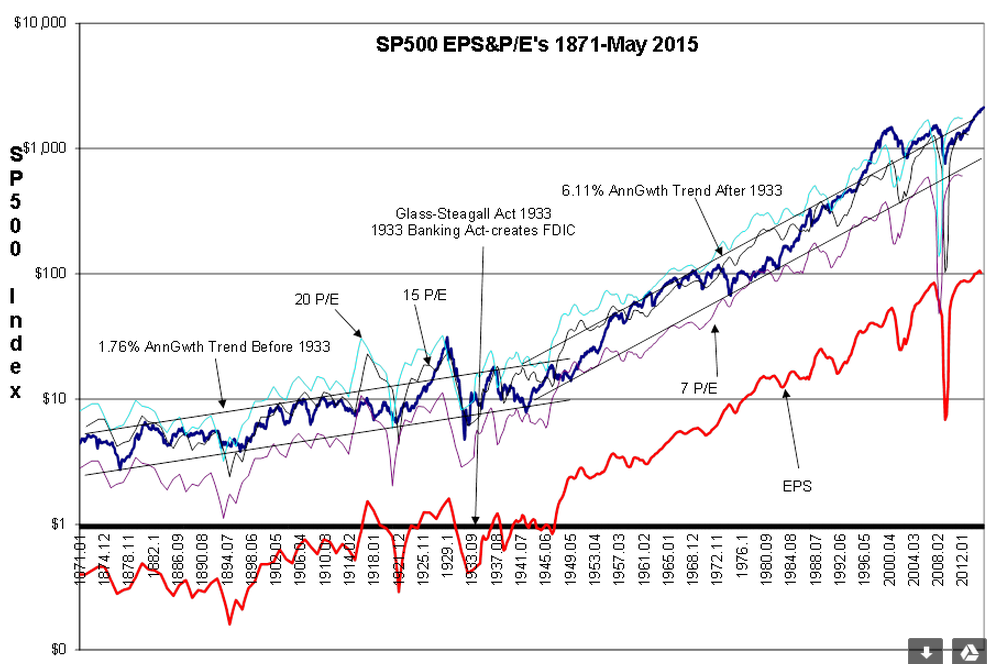
I present this chart below with my notes.
The overwhelming majority of approaches towards market analysis has been and remains mathematically based. The trend towards mathematical analysis is based on the belief that most analysts ‘emotions’ cloud their judgment. Using mathematics is deemed to eliminate human emotion. It is the ‘Scientific Method’. Mathematics does not allow human emotion, the belief in things unsupported by factual observance, to enter the analysis. This, it was assumed, would reveal the true relationships present in prices and make markets more predictable. To date, we have not succeeded with the mathematical approach.
The approach I recommend and the direction I have taken in my work is not used by any other analyst (at least as far as I can ascertain). My view is that markets are human systems of market psychology. Prices are set by what we think things are worth at the moment. Prices are set by market psychology and the very human rules we impose on the exchange of goods and services. This system evolves with human needs and desire. We constantly change these rules with the desire to make human interaction ‘more fair’. What we think is ‘fair’ at one point in time is often viewed differently at a later date. Sometimes we make changes in accounting rules and other times we define some behavior as illegal. Let us not forget that we constantly juggle of the tax laws to achieve desired ends. Human systems are so complex and evolving that no amount of mathematical analysis will ever permit prediction of the future. But, our human system while not actually predictable, does let us make empirical observations which lead to reasonable guestimates of the future.
Empirical analysis simply described is the act of looking for trends and then seeking answers for what we see. If the trend is ‘long enough’ in one’s judgment and analysis of the underlying factors, then one can use that trend as an estimate of anticipated results. Much is dependent on one’s judgment! All of my work is empirical. Mathematicians cringe!! But, I believe empirical analysis provides the better perspective and will adjust to changes we make to our human system while mathematics cannot ever hope to do so.
The Empirical Approach
The empirical approach forces one to consider differences in market performance prior to 1933 vs. that after 1933 and to examine why P/Es rise so much during economic expansions. The empirical approach questions periods during which we had earnings performance but not market performance as during periods of inflation. The empirical approach causes one to examine how various investors and analysts thought about market prices vs. the business cycle over history.
FDIC Outcome
Once one has examined our market history in detail with a goal of learning about the market thinking of Jon Stewart Mill, John D. Rockefeller, Hetty Green or Warren Buffett (and many other) and how and why we have legislated the rules we imposed and what those rules actually did, one begins to realize the ‘extraordinary humanness’ of markets. One can learn that the creation of the FDIC as part of The Glass-Steagall Act in 1933 was an afterthought. It was this rule making which caused bank speculator risk to be shifted away from the ordinary business people and homeowner-savers (the providers of capital to banks) towards the speculators and tycoons. Up till 1933, when a bank which had lent imprudently and more often than not speculatively failed, it took all the savings of its depositors and the collateral pledged for the loans it had issued. Net/net bank failure created a trove of assets created by hard work of millions of individuals striving to become part of the middle class to be picked up by already wealthy savvy investors at a discount. The term ‘Robber Baron’ came into vogue as wealthier and more savvy investors were further enriched every time banks failed.
The implementation in 1933 of FDIC caused savings and lending contracts to be transferred to healthy institutions. In effect, the middle class no longer saw their accumulated life savings wiped out by imprudent bank lending. The earnings and growth history of the SP500 is demarcated by the FDIC inception in 1933-see the chart. Prior to 1933 the SP500 and associated earnings have a growth rate of ~1.75%. After 1933, middle class wealth growth is maintained. After 1933, we see broadening economic participation by our population. After 1933, we built a successful middle class. After 1933, the SP500 and associated earnings reflect a ~6.1% growth rate. Many to this day believe that Federal Reserve banking regulations have been the reasons for this success, but if one reads about the many financial failures since 1933 one concludes it was FDIC and not better regulation which was the key element of Glass-Steagall. Our most recent sub-prime financial collapse, even when it was obvious to many, was not prevented by active Federal Reserve regulation. Only Fed actions after the fact made the collapse less onerous (or maybe not). The impact of FDIC has been underappreciated.
P/Es, Price & Mathematics-Not Very Predictable
Market P/Es tend to expand later in the economic cycle and severely contract during economic contractions. Why? Most would agree that this is due to changes in market psychology. But, then why do we not teach this as part of our higher education system and persist in trying to find mathematical models to predict every movement in prices? Mathematics to be applicable requires fixed measurements of the things we are trying to analyze. But, prices are based wholly on individual perceptions, i.e. market psychology, and this is not something we have ever been able to measure. The fact that prices are expressed as $Dollars and Cents per share does not change the fact that price at one point in time differs by an immeasurable amount of market psychology at another point in time. Mathematics cannot handle this. Further, we can see that SP500 does not even act in lock-step with its earnings performance. We do not think identically from one business cycle to another. In addition to individual business cycles, SP500 history shows a long period of P/E contraction for 1965-1982 followed by a long period of P/E expansion to 1997. These changes spanned multiple business cycles.
There is no mathematical explanation which can explain SP500 performance from 1871-Present. Nonetheless, many persist in trying to develop such. Many economists and financial analysts are annually awarded PhDs for their attempts at mathematical market modeling. This year ~170,000 CFAs (Chartered Financial Analyst) will be awarded for learning the models which have entered main-stream thinking. Unfortunately, there is no model which explains the impact of FDIC or even considers it. There is no model which explains P/E contractions or expansions successfully. There is no model which explains or predicts inflation or its impact on market P/Es.
What works?
What works is the empirical approach. Observe what we have done! Learn what we did to get there! Little of our history has ever been predicted. But, we can empirically see which rules had impact over the long term and those which did not. We can see empirically which are the better indicators. We must always remember that we can always change our outcomes by changing the rules by which we operate. Mathematics can never predict our future when it is us changing our rules as we feel the need. Yet, we can see a long term earning’s growth trend of 6.1% in spite of more than 70 years since FDIC’s inception and this is very helpful.
What is very predictable is the human desire to improve our outcomes, our standard of living and our children’s futures. Certain patterns in our buying behavior repeat each cycle. Buying new vehicles, buying single-family homes, spending on new clothes and entertainment expenses while not predictable with precision as to amount or timing are more or less likely to be higher in dollar value each business cycle. There are certain levels of spending society demands to fulfill its needs. These trends can be tracked even if, as in the current, cycle the Fed has changed lending environment.
History shows we tend to achieve ~6.1% SP500 earnings growth long term. History shows we do not see a peak in the business cycle till we stop hiring. As long as we are adding to employment, the cash flow of our economic activity increases. We buys vehicles! We buy homes! Our spending expands! Once we stop hiring in any cycle, we enter a correction. When this occurs, while it is not predictable , it is relatively easy to see it develop. Economic trends usually give us more than 12mos to exit equity before portfolios are caught in a correction.
I hope these comments explain why precise predictions for any investment are impossible. But, it should be clear that we do not need precision as long as we can identify the important underlying trends.
Thus far, all important trends suggest higher equity markets ($SPY) lie ahead of us.