I’ve seen CAPE being used more and more by folks to justify the “market is overvalued” meme. I find CAPE to be deeply flawed for a simple reason. FAS 157 adopted in 2008. FAS 157 fundamentally changed “E” in the “PE” Schiller uses for comparisons. Because of that, measuring today’s PE ratios with those of even a decade ago is a fruitless exercise. FAS 157 has caused earnings to become more volatile. Witness:
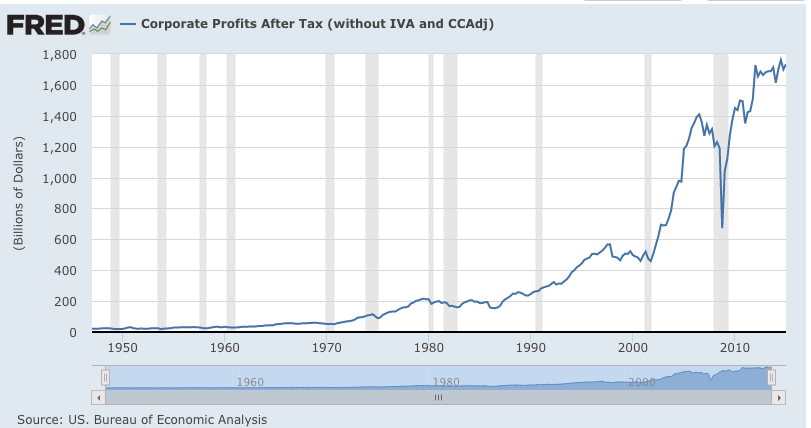
Does anyone really believe the core earnings of corporate America fell from $1.4T to $700B in just two years? Of course they didn’t. What did fall was the value of assets most had no intention of selling during a panic. This then produced “losses” on the income statements of these companies. Once the panicked sellers had run their course, these assets magically produced profits as their values were then written back up. This is a purely post-2008 phenomena and makes any comparison of PE valuations between post-2008 and pre 2008 time periods folly at best.
“Davidson” submits:
From Wikipedia CAPE: The cyclically adjusted price-to-earnings ratio, commonly known as CAPE,[1] Shiller P/E, or P/E 10 ratio,[2] is a valuation measure usually applied to the US S&P 500 equity market. It is defined as price divided by the average of ten years of earnings (Moving average), adjusted for inflation.[3] As such, it is principally used to assess likely future returns from equities over timescales of 10 to 20 years, with higher than average CAPE values implying lower than average long-term annual average returns. It is not intended as an indicator of impending market crashes, although high CAPE values have been associated with such events.[4]
Shiller makes a number of errors of perception.
1) The first is that market prices are already adjusted for inflation over time. I show this with the SP500 Intrinsic Value Index. It is Value Investors who price inflation into prices at recession lows. For Shiller to add another inflation adjustment to earnings and leave price unchanged is actually lowering the denominator in the P/E ratio making the ratio higher than it should be in a market which already sees an inflation adjustment. This makes look more expensive than Value Investors would perceive using CAPE P/E.
2) Shiller uses long term P/Es for comparison when FDIC completely changed economic rules in 1934 by placing bank failure risk on investors and not on savers. Using any data pre-1934 in comparison to data post-1934 is like trying to compare oil to water. SP500 market growth/earnings growth pre-1934 was about 1.76% compounded from 1871. Post-1934 we have our modern 6.1% compounded growth in SP500/SP500 EPS.
3) Lastly but not least, Momentum Investors drive P/E to crazy levels as the economic cycle works towards a peak. P/Es used in Shiller’s averages lose any sense of reality when this occurs the further market prices are away from the SP500 Intrinsic Value Index(Value Investor valuations). This is the primary issue with how most people treat numbers especially market prices as accurately representing the value contained in markets. Prices are psychological perceptions of investors of which we have all types, but mainly Value and Momentum. Momentum Investors are the overwhelming majority, perhaps 99% depending on how tight you make the definition. Momentum Investors claim to ,use ‘value’ but they do not have a clue what they are talking about. Icahn, Klarman, Tepper, Soros, Asquith, Dalio and a host of other claim to know value but they are Momentum Investors with a longer time perspective. This is why identifying how Value Investors think and invest leads to ‘The 1% Solution’ to market pricing. Pricing is correct about 1% of the time, perhaps even less, again depending on how tightly you define it.
Prices are numbers which carry market psychology and market psychology is never the same from price to price with respect to the mix of input from Value vs. Momentum approaches. This is why Wicksell’s observation of there being a ‘Natural Rate’ is so important. The ‘Natural Rate’ is the long term GDP (RGDP + Inflation) which because of economic cycle variation the only way to get to this is to take all the data from 1930-Present and find the long term trend. Even though psychology is underneath the cyclical nature of economic activity, the values which measure economic activity are relatively hard measures. GDP data is not a measure of market psychology! Earnings are not a measure of market psychology, i.e. they are hard values as well. Cyclical earnings are charted to locate the long term trend and mean. The two long term trends from GDP and SP500 Earnings are hard data (not psychology based) inputs to the SP500 Intrinsic Value Index. The SP500 Intrinsic Value Index is empirical in that it comes from observations of the long term trends. It works because it captures the way Value Investors come to decisions about market valuations. Value Investors make the best value comparisons between GDP growth and individual investment opportunities. Momentum Investors simply follow tends. This is why the SP500 Intrinsic Value Index tracks recession lows.
There is nothing which can be called ‘hard value’ in markets. If society changes the rules, valuations can change. If China were to suddenly become a ‘Free Market’ and have a higher growth rate than the US, then relative valuations would change and a period would be required for the data to tell us how Value Investor thinking adjusted. But, something like this never occurs over the short term. It takes generations on generations to establish Free Markets, a Free Market is a state of mind, it is a cultural mindset based on the belief that one’s self is more competent to make life/economic decisions than government. The US is the only Free Market at the moment.