What is interesting is that historically this number has been > the $SPY and its intrinsic value. I think the fact that it has stayed below since the recovery illustrates the vast pessimism still present in the market. It also means that by no means are stocks overvalued at these levels. It also means that since employment remains strong the overall uptrend in the market will continue eventually.
“Davidson” submits:
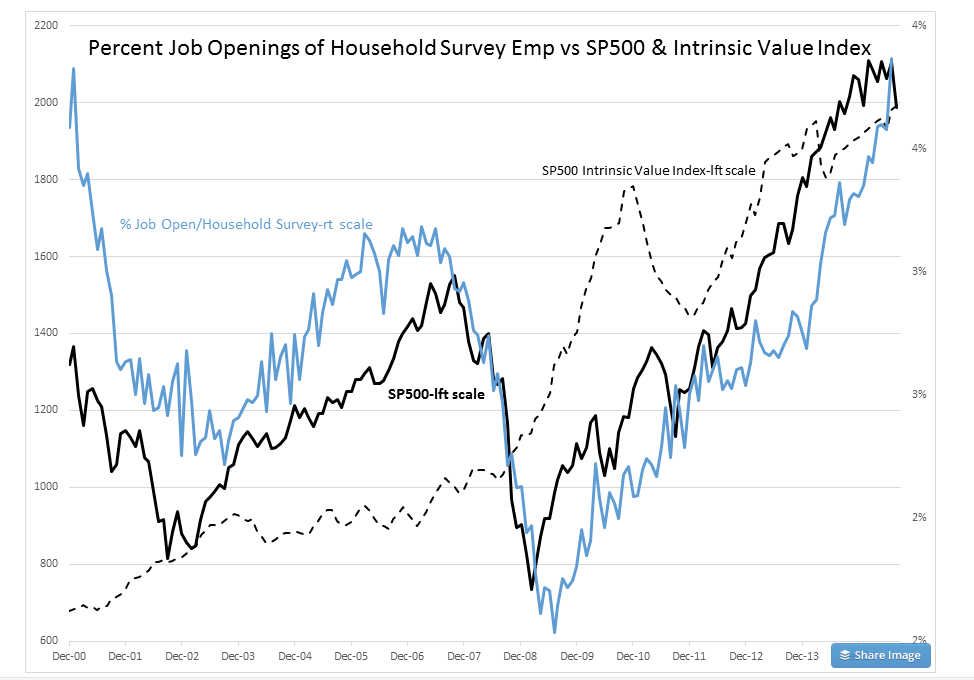
The % Job Openings to Household Survey Emp is plotted against SP500 and SP500 Intrinsic Value Index.
1) Data comparison is limited to Dec 2000-Present which is the extent of Job Opening data as a relatively new index
2) Chart shows connection between economic activity and investor psychology-SP500 set by investor valuation psychology
3) Intrinsic Value Index shows the Value Investor buying level, i.e. market finds support at this level as Value Investors ramp up their buying just as today
4) SP500 pricing above Intrinsic Value Index is due to Momentum Investors chasing economic activity and what they perceive as market trends
5) Economic activity drives equity pricing with Value Investors pricing lows and Momentum Investors pricing peaks
6) The SP500 2009 low fell well below Intrinsic Value Index due to FAS157 coupled to elimination of ‘Up Tick Rule’ and Hedge Fund trading.
7) SP500 has risen from 2009 in face of extraordinary pessimism which continues today.
8) Expectations are for a multi-year period of excess optimism and excess pricing before the economy peaks, a reversal of current pessimism.