“Davidson” submits:
New Residential Sales of Single-Family Homes were reported today with Monthly Supply of New Homes for Sale at the 5.5mos level. Reported as well was the Fed’s 12mo Trimmed Mean PCE inflation measure at 1.7%. Together these indicators are in agreement with other economic measures that:
1) Economic expansion continues in an uptrend.
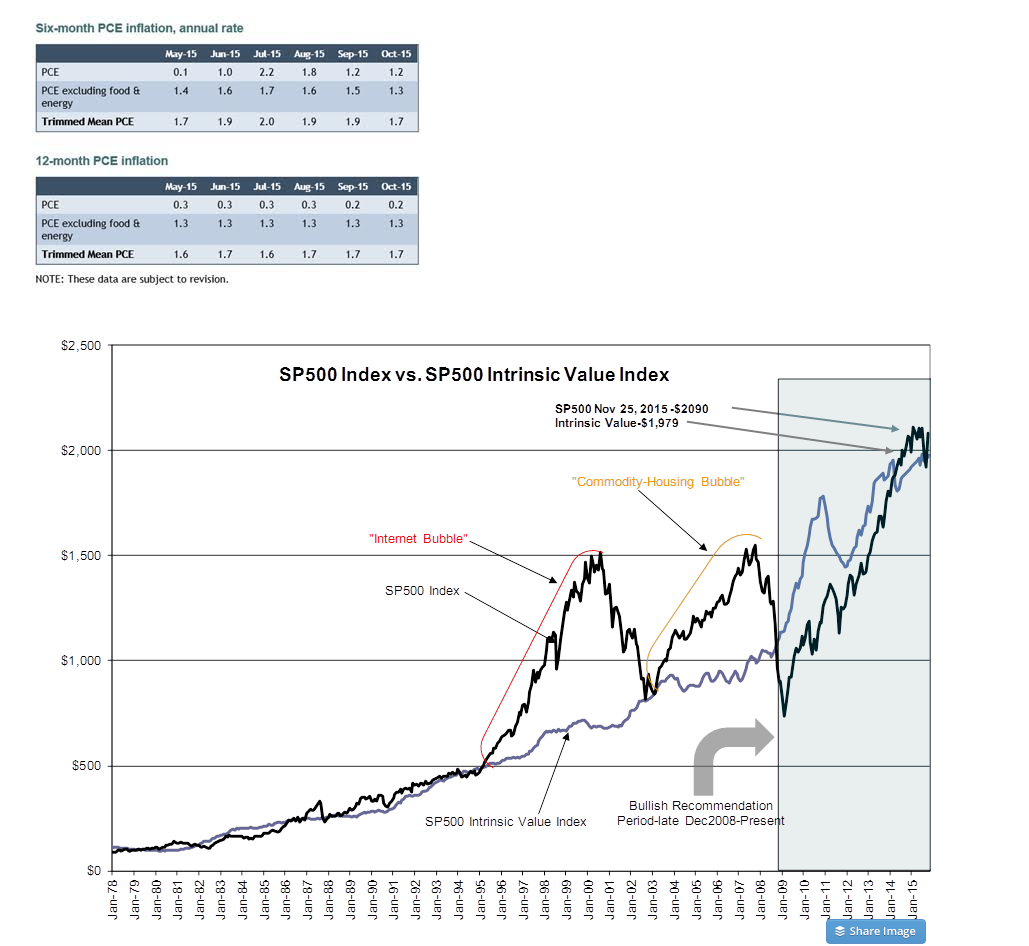
2) The SP500 ($SPY) is priced ~5% above the Intrinsic Value Index, a sign of little market speculation.
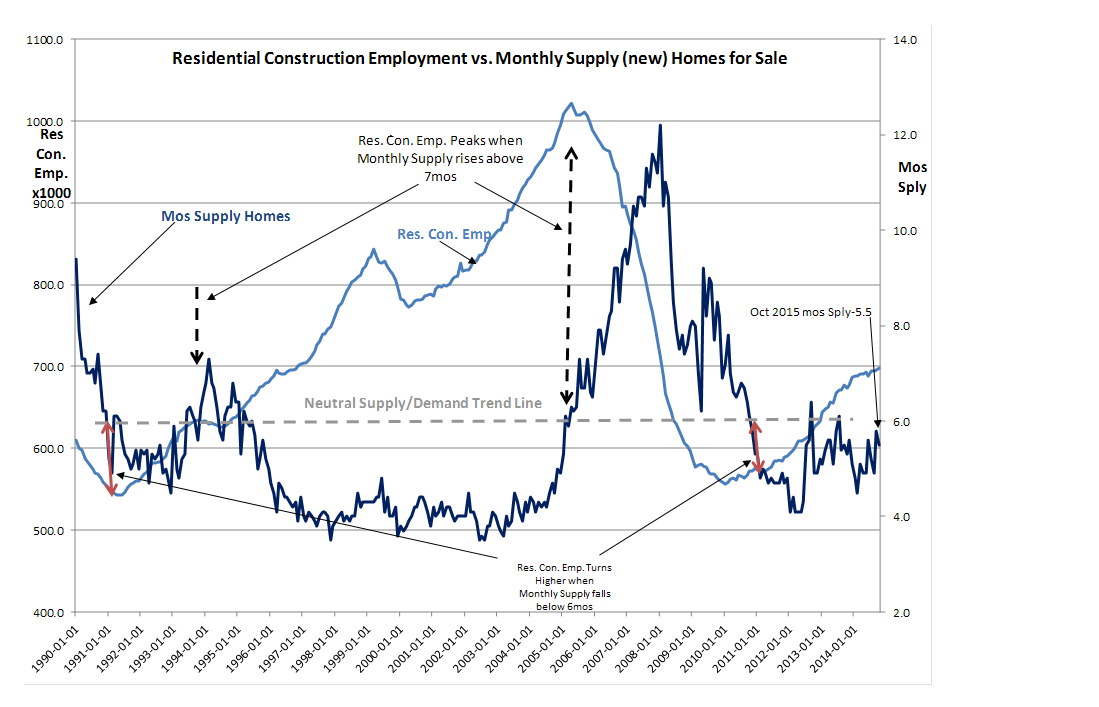
New Home Sales Monthly Supply represented by the DARK BLUE LINE in the chart with Residential Construction Employment represented by the LIGHT BLUE LINE. Residential Construction Employment rose to 698,4000 (higher by 2,400 vs. Sept) last month. Residential Construction Employment is a record for the current cycle and in an uptrend.
A little surprising are the actions of various regulatory agencies which continue to ratchet higher the requirements for bank reserves on top of what had been agreed as adequate even 6mos ago, but the housing market appears to be finding a path to satisfy the demand for Single-Family Housing.
The Dallas Fed reported the 12mo Trimmed Mean PCE inflation level at 1.7%. What is interesting is the 6mo Trimmed Mean PCE showing an uptick since June 2015. Even though the 6mo value was reported also to be 1.7%, future levels may drift higher eventually pulling the 12mo level higher. Higher inflation is correlated with higher Real Government Expenditure&Investment. There are early signs that real government spending is rising. Higher inflation factors into a lower relative SP500 Intrinsic Value. But, past markets show that investors believe equity prices rise faster than inflation. Inflation has generally caused investors to swap Fixed Income for Equity in portfolios which drives equity prices higher. The end result is a widening of the spread between the SP500 BLACK LINE and its Intrinsic Value Index INDIGO LINE in the chart below. The spread at the moment is ~5% reflects a low level of general market speculation, but the past reflects spreads 55%-100% vs. the SP500 Intrinsic Value Index when investors were chasing market momentum. The perception of being able to achieve growth which out distances inflation by investing in equities over bonds has been an important driver in the past two market peaks. That this spread remains relatively low indicates that opportunity continues to be present in LgCap Equities.
With signs of a rise in government spending, I suspect we are likely to see a rise in inflation. The typical investor response has been to sell Fixed Income and buy Equities. I do not see anything which is likely to be different this time.