“Davidson” submits:
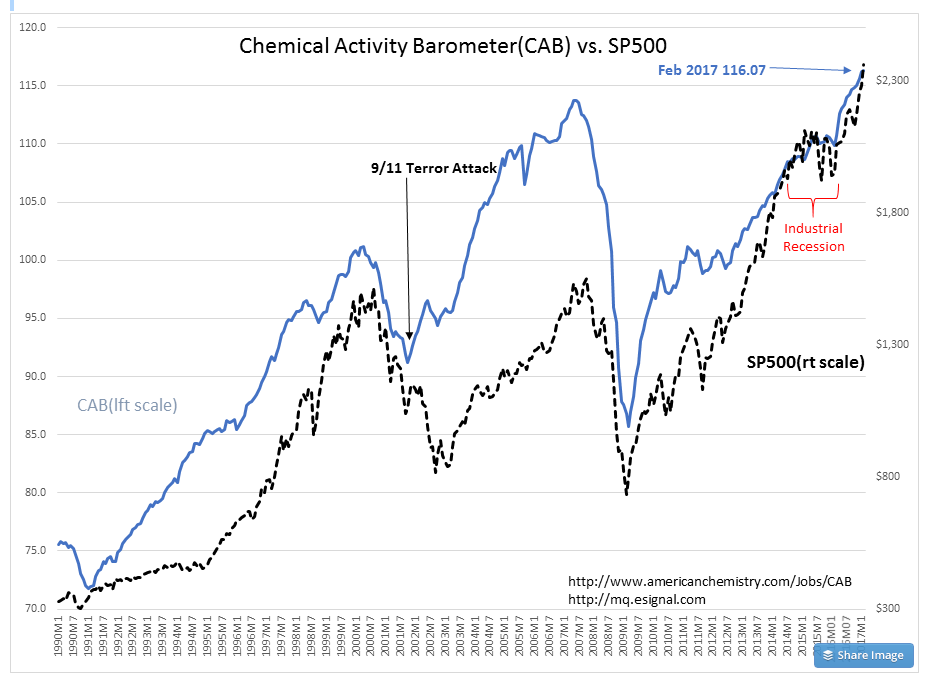
The Chemical Activity Barometer(CAB) hits a new high and predicts higher equity markets ahead. The Chemical Activity Barometer(CAB) vs. SP500 shows the past 26yrs of history, but the CAB’s inception dates to 1919. It was first introduced June 2014.
https://www.americanchemistry.com/Jobs/CAB/
The CAB leads by two to fourteen months, with an average lead of eight months. The CAB is a composite index which is comprised of indicators drawn from a range of chemicals and sectors, including chlorine and other alkalies, pigments, plastic resins and other selected basic industrial chemicals. It first originated through a study of the relationship between the business cycles in the production of selected chemicals and cycles in the larger economy. Other specific indicators used include:
- Hours worked in chemicals;
- Chemical company stock data; publicly sourced, chemical price information;
- End-use (or customer) industry sales-to-inventories; and
- Several broader leading economic measures (building permits and ISM PMI new orders).
The US economy experienced an industrial recession in 2014-2016 due to rapid strengthening of the US$. Oil prices and other commodity prices plunged. US industrial companies entered a recession in the middle of a general economic expansion. After a period of adjustment including 6%-8% layoffs and the US$ stabilizing, the CAB began to signal improvement after March 2016. Since then, the CAB has accelerated.
The CAB leads major economic forecasting tools on average by 8mos. Rehiring of employees in US industry has yet to appear. Earnings have for the most part stabilized and few companies have issued better than expected reports. The pace of new highs indicates earnings are likely to be better than many expect.
New highs in the CAB are positive for higher equity prices the next 12mos.