“Davidson” submits:
The Chemical Activity Barometer (CAB), a leading economic indicator created by the American Chemistry Council (ACC), posted its strongest year-over-year gain in nearly seven years. The 5.5 percent increase over this time last year reflects elevated consumer and business confidence and an overall rising optimism in the U.S. economy.
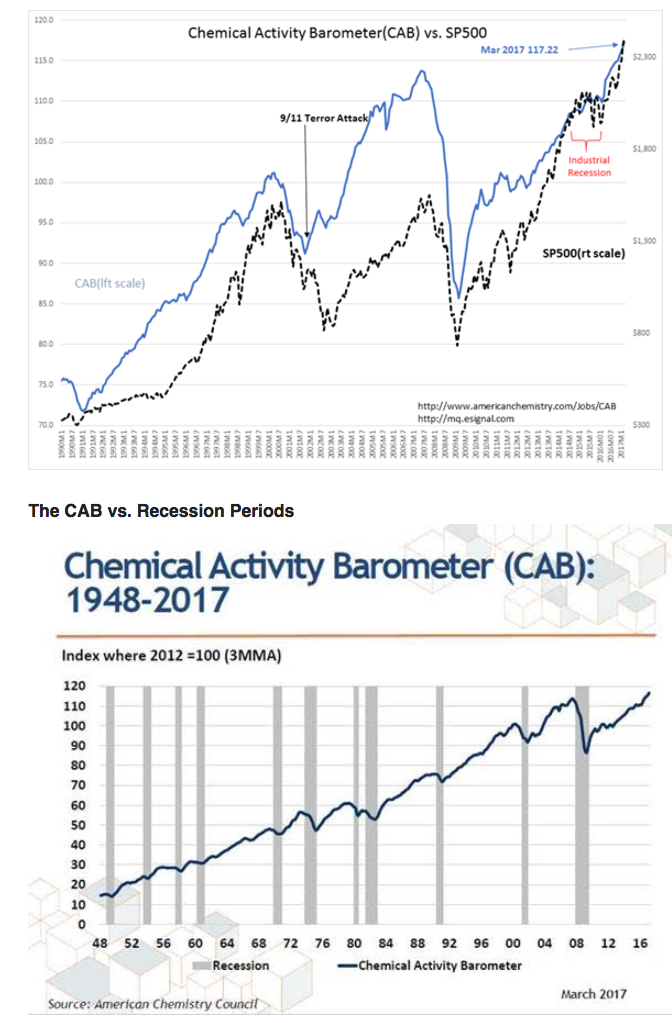
“The index provides a longer lead (performs better) than the National Bureau of Economic Research (NBER). The CAB leads by two to fourteen months, with an average lead of eight months. (see the 1948-2017 chart vs. US Recession Periods)
The CAB is a composite index which is comprised of indicators drawn from a range of chemicals and sectors, including chlorine and other alkalies, pigments, plastic resins and other selected basic industrial chemicals. It first originated through a study of the relationship between the business cycles in the production of selected chemicals and cycles in the larger economy. Other specific indicators used include:
- Hours worked in chemicals;
- Chemical company stock data; publicly sourced, chemical price information;
- End-use (or customer) industry sales-to-inventories; and
- Several broader leading economic measures (building permits and ISM PMI new orders).”
Man-made chemicals and products derived from chemicals have permeated and raised modern standards of living for more than 100yrs. Transportation, health maintenance, shelter, education, safety and likely any facet of life one could imagine has been made less costly, safer and more convenient through the use of plastics. It should be no surprise that an indicator such as the CAB should be sensitive to economic activity.
The current rise began April-May 2016 after US corporations had adjusted to the strong US$. It has accelerated since the Presidential election. The SP500 is generally correlated with the CAB but for periods in which market psychology differs from economic trends. Such a period occurred after Sept 11, 2001, “9/11”. Markets continued to fear terrorism’s impact on economic activity while the CAB showed that Sept 2001 was the month the recession ended. It took another 12mos for the SP500 to bottom. This is the best example we have of market psychology so diverged from economic conditions in our recent history. It shows why, for long-term Value Investors, economic activity provides the best insight when making investment decisions.
The current trend in the CAB is a forecast for better economic news than many expect. This should result in higher equity prices as investors become more optimistic.