“Davidson” submits:
Lot of economic data supporting existing trends, big shift in US$ underway
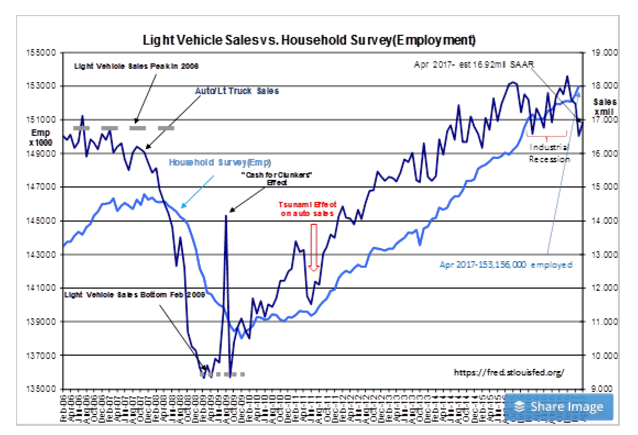
Employment trends in place since 2009 continue with May 2017 reports. Vehicle sales remain historically high as the avg age of vehicles remains in 11yr-12yr range. Reports by CAT, DE, UTX, XOM, PX and the Chemical Activity Barometer reflect recovery in industrial, energy and chemical industry sectors which should report additional high wage employment in the months ahead.
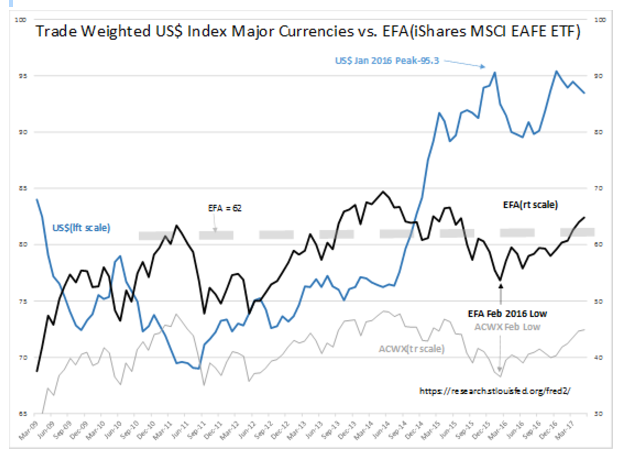
The US$ is beginning to drop back to the long-term trend which is ~30% lower than current levels in the Trade Weighted US$ Index Major Currencies. This is correlated to the rise in the EFA(iShares MSCI EAFE ETF) which was recently priced at 64.87. Even though the EFA and US$ tend to correlate, which shifts first does not have a simple relationship. History shows that the US$ shifts based on investor perception of where returns are best. How this is executed and what were the precise drivers are more often than not seen only in hindsight. The most recent US$ strengthening showed a marked correlation with the Russian invasion of Ukraine and was tied by Momentum Investor algorithms inversely to $WTI(West Texas Oil Price) and other commodities priced in US$.
Even without a significant shift having not yet developed in the US$ from recent peaks, there has been a sizable improvement in Intl Equity returns since Feb 2016. In my experience, the US$ should continue to drift lower and Intl Equities should continue to stregthen relative for US investors.
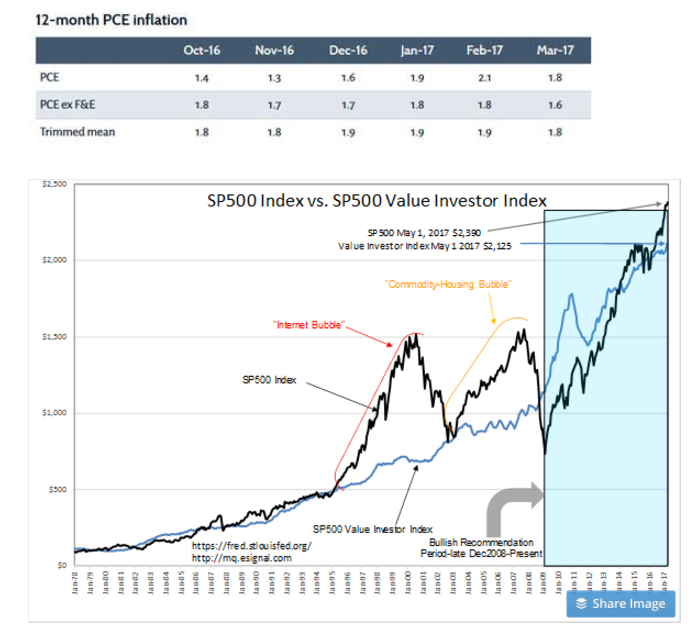
Dallas Fed reports 12mo Trimmed Mean PCE of 1.8%
Markets can be simply viewed as Value or Momentum Investor driven. The SP500 Value Investor Index is designed to mimic the market level which has been attractive to Value Investors. Value Investors are responsible for significant market cycle lows. Momentum Investors are responsible for high valuation levels at market cycle peaks.
The 12mo Trimmed Mean PCE(inflation measure) is part of the Value Investor Index construction. Lower inflation equates to justifiably higher stock prices. Higher inflation has a long market history of forcing earnings to be priced at lower PEs. This is due to Value Investors making inflation part of their mental market capitalization calculation. Higher inflation makes anticipated earnings worth less than when inflation is lower. Today’s Dallas Fed report saw a drop of 0.1% vs the past 3mos and the SP500 Value Index reflected a rise to $2,125. The SP500 at $2,390 sits ~12% higher. The major market peaks 2000 and 2007 registered ~100% and ~60% premiums respectively. Today’s market is not overly speculative by comparison.
Markets have a long history of rising with rising lending spreads. The current T-Bill/10yr Treasury rate spread, a proxy for lending spreads is currently 1.55% and rising after a brief pull-back from Jan 2017 level of 2.00%. Markets peak when this rate spread falls to 0.2%. An excessively priced SP500 relative to the SP500 Value Investor Index with the rate spread falling to 0.2%-0.0% range is a signal that a market top and significant correction is at hand. There is no sign of this occurring anytime soon.
I expect economic expansion to continue for 3yrs-5yrs. Economic indicators tend to signal 24mos to 8mos ahead of market tops. I encourage investors to add to equity positions.