“Davidson” submits:
The current market volatility roils our wealth. Whenever this occurs, many believe the market is about to fail causing great permanent losses. That great losses are not suddenly upon us and that the market is not about to ‘irreparably fail’ requires perspective, a long-term perspective. The simple answer is that markets have never failed.
That is a dramatic statement but is supported by thousands of years of recorded history. A history which is dated to the age of the Sumerians 5,000BC from which we have the first known market records. https://en.wikipedia.org/wiki/Sumer. The facts are that markets are innate to being human and have been our means of sharing unique human talents as we have advanced our standard of living for millions of years. We mostly have lost sight of this when we take a short-term focus of investment markets and become overly concerned with tomorrow’s trade. A short-term focus has many believing that investment markets are some mechanical system external to ourselves, like a complex clockwork, which is prone to breakage. The investment markets, while complex with an overwhelming amount of seemingly unconnected detail, are only a more sophisticated means of talent-sharing. In the process each of us seeks to gain an edge of personal success to advance our own standard of society by making risk-based decisions. Market prices are set by our anticipation of future outcomes, i.e. market psychology. In the process, every market recorded has its periods of shifting too far to one side which requires a period of adjustment back towards the main trend of the period. Markets develop trends as society advances with many little bubbles correcting along the way. Most of these are ‘head-feints’. They come on suddenly without explanation and we fear they will turn into a major loss to our standard of living and a mini-panic occurs. The current volatility is one of these events. How one knows this derives from a long-term perspective.
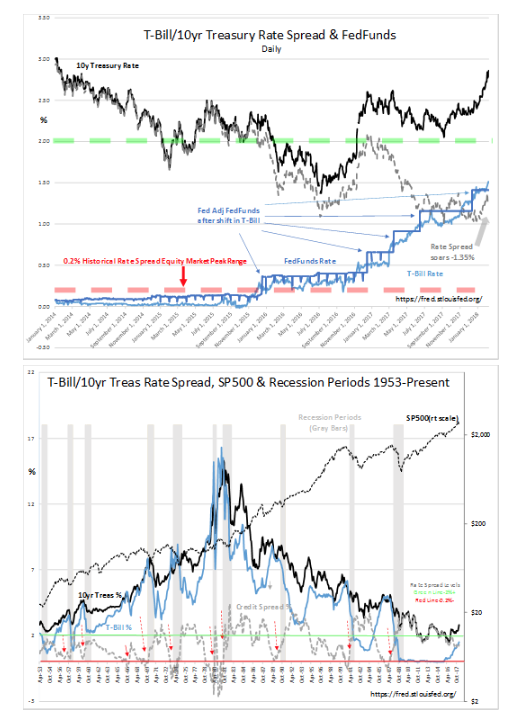
A very useful measure of investment markets is the T-Bill/10yr Treasury rate spread. A daily chart from January 2014 to February 8th 2018 and a monthly chart from January 1953 to February 2018 provide the near-term and long-term perspective to invest in the current volatility. Click and drag the chart corners to expand viewing the detail.
In each chart, the 2% and higher level is noted by the Dashed Green Line while the 0.2% level and lower is noted by the Dashed Red Line. Economic cycles are driven by the willingness of lenders to lend. The T-Bill/10yr Treasury rate spread is a good proxy to measure the propensity to lend and in the process becomes a leading indicator for economic activity. The trend in economic activity is what drives the financial news which in turn is what drives market psychology and market prices.
T-Bill/10yr Treasury rate spread drives economic activity which in turn drives the financial news which in turn drives market psychology which in turn drives market prices.
Our economic cycle is characterized by changes in the T-Bill/10yr Treasury rate spread. At market tops, investor speculation becomes dominant with investors selling T-Bills in an attempt to capture higher returns which drives T-Bill rates to levels equaling the 10yr Treasury. The rate spread collapses lending spreads and the pace of lenders issuing new credit falls sharply. Economic correction ensues shortly thereafter and a market correction shortly after that. In the ensuing scramble to avoid losses, investors buy safe assets, i.e. short-term Treasuries, which drives these rates down sharply causing the T-Bill/10yr Treasury rate spread to widen. Since 1971, investor panics/economic recessions have been characterized with T-Bill/10yr Treasury rate spread greater than 2%, the Dashed Green Line. Recession lows occur with the 2% and higher T-Bill/10yr Treasury rate spread. Lenders return to lending prudently and cautiously to their highest credit quality borrowers. Investors and lenders alike remain pessimistic for several years as the sudden correction colors future expectations. This period of pessimism is due to “The Recency Effect” in which a period of recent experience impacts future expectations. Gradually, market psychology comes to the conclusion that the world is not coming to an end. The T-Bill rates begin to rise as investors cautiously reenter equities. This narrows the T-Bill/10yr Treasury rate spread to 1%-2% which is typical of average economic expansions. Lending continues to expand which expands economic activity. Eventually, several years of positive economic surprises shifts “The Recency Effect” into a period of optimism which results in the selling of T-Bills to capture higher anticipated returns. The T-Bill/10yr Treasury rate spread falls again to 0.2% range and cycle tops. We come full-circle. The T-Bill/10yr Treasury rate spread is not only one of the most useful economic indicators but is also a useful indicator of market psychology.
The Investment Thesis:
The T-Bill/10yr Treasury rate spread is one of a number of very useful indicators which are not in general use. Our current market cycle has had many dire forecasts calling for its demise none of which the T-Bill/10yr Treasury rate spread has supported. The same holds true today. The T-Bill/10yr Treasury rate spread rose sharply after the Presidential Election with investor expectation of tax and regulation cuts. Then, it narrowed as it appeared the current administration was having difficulty implementing its stated agenda and has since widened with the success at achieving the new tax law and the revelation that the pages of the Federal Register for 2017 were ~35% lower than 2016. Today the T-Bill/10yr Treasury rate spread has risen to 1.35% with a general rise in rates. Rising rates are a sign of investors selling Fixed Income in favor of equity. What remains more important is the T-Bill/10yr Treasury rate spread at any point in the cycle. The T-Bill/10yr Treasury rate spread shifting to 1.35% is a strong indication that lending is likely to expand, the economy should accelerate and equity markets should rise in response the next couple of years. The best estimate looking through the current ‘Fog of Volatility’, is for significantly higher equity markets 3yrs-5yrs from today. This is the long-term perspective not tomorrow’s trade.