“Davidson” submits:
Every market has unique drivers. Most investors anticipate future trends using past market history. But, when the past never repeats, then predictions based on the past are worse than pure guesswork. The consensus on the Yield Curve, current US tariff policy fit the ‘guesswork’ category. Several data series charted monthly over many decades offer a long-term perspective. When compared with the short-term daily record, the long-term helps to explain current market drivers. The short explanation is that today’s markets represent a culture clash regarding the ‘perception of value’ in financial assets. Here is an attempt to explain this.
Three charts, Trade Weighted US$ Index Major Currency vs. $WTI Crude Price from 1973, Trade Weighted US$ Index Major Currency vs 10yr Treasury Rate from 1973 and 10yr 3mo Treas, Rate Spread & Fed Funds Daily from 2012 are helpful with this explanation. Markets are driven by human perception and behavior. As events evolve, investors respond. As most investors have a short-term focus and not the time to read our social history within the context of our financial history, most have turned to following price trends which is the basis of our business school educational system. It is far easier to take numerical data and run hundreds of mathematical regression studies, declare an outcome and publish a paper with a quarter-over-quarter focus than study human behavior over decades of history. The tangible outcomes and market forecasts from mathematics seem far more satisfying than the uncertain, intangible and unpredictability range of possibilities of the Human System. Our educational institutions lean towards teaching Momentum Investing. Teaching a mathematical approach fits well within 4yr BA, 2yr MS and 3yr PhD programs while understanding the Human System has no teachable end-point. Momentum Investing is insensitive to significant changes in history or fundamentals. Forms of Momentum Investing have always been present and this is why there have never been uniform valuation/fundamental metrics which make sense.
Our Human System is constantly evolving, always seeking to raise our standard of living. As our global society become more connected, US markets become subject to global actors, good and bad As trade expands so does the wealth of individuals in developing and emerging nations. In turn, the newly wealthy of these nation seek to protect their wealth using global options not previously available. A culture clash occurs when the newly wealthy of emerging cultures enters financial markets with hundreds of years of established financial understanding. The impact of culture on capital decisions is lost if one does not study what is behind those decisions. One can discern cultural preferences which can skew market prices over time.
The established consensus tends to believe that everyone thinks as they do and misses the impact of emerging cultural biases. The established culture carries the beliefs long taught in the most prestigious educational institutions that those who have the best business educations and longest market experience are the ‘smartest investors’. It is an inherent myopia. One of these assumptions is that price trends reveal fundamental economics. A significant portion of investors are increasing reliant on computer driven algorithms. Algorithms do not capture the capital biases of newer cultures entering the established financial system.
As part of the current state of things, we need to add the 2007 short-selling rule change which has been responsible for 10%-20% selloffs experienced by individual issues on news deemed to be unexpected negative events. The short sale rule is explained at Investopedia.com:
https://www.investopedia.com/terms/s/shortsalerule.asp
“Under the short-sale rule, shorts could only be traded at or above the most recently traded price of the security if the most recent price movement was upward. It forbade with only limited exceptions the trading of shorts on downticks in the share price. The rule was also known as the “plus-tick rule,” “tick-test rule,” or “uptick rule.”
The rule went into effect in 1938 and was lifted by the SEC in 2007, allowing short sales to occur (where eligible) on any price tick in the market, whether up or down. However, in 2010 the SEC adopted an alternative uptick rule. It does not apply to all securities, and restrictions in trading on downticks are generally only restricted in narrowly-defined circumstances, such as when the price of a security has dropped by 10% or more from the previous day’s closing price.”
Because market speculators like Jesse Livermore (“Reminiscences of a Stock Operator”,1923, by Edwin Lefèvre) routinely could create market panics and profit using unfair manipulative practices, the SEC in 1938 recognized the destabilizing impact of speculators and established what was known as the “Uptick Rule” for short sales. Today’s market has seen price shifts not explained by reported events due to algorithmic trading. Computer trading can short-sell shares without having to wait for an opposing uptick in price. This means share prices can fall dramatically and very quickly till the selling finds enough support. Traders justify this activity as ‘markets finding their own levels’, but in hindsight the longer-term evidence often reveals such short-term selling as unjustified by fundamentals. Net/net, eventually fundamentals are the driver of market prices, but short-term computer driven down-drafts keep newer inexperience investors away from equities in my opinion.
A lesson one learns over time is that sharp moves in prices are rarely driven by fundamentally changed circumstances. Fundamentals evolve over time, usually over multi-year periods, while sudden price shifts are the result of shifts in market psychology or anticipated shifts in market psychology that are built into computer driven algorithms. Yes, indeed, there is a significant percentage of the investment community who believe computers make faster and better decisions than humans. They are the same group of investors who are deemed traders and short-term thinkers trained at the more prestigious business schools with strong mathematical skills. They are Momentum Investors who daily provide the ‘expert advice’ which feeds the financial media such as CNBC. The opinion provided is myopic and self-serving in my opinion. A better investment understanding requires a deeper assessment of the various cultural biases behind capital allocations which have changed and will continue to change as markets continue to evolve globally.
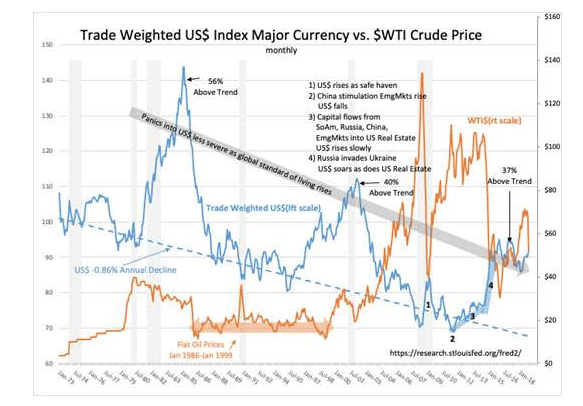
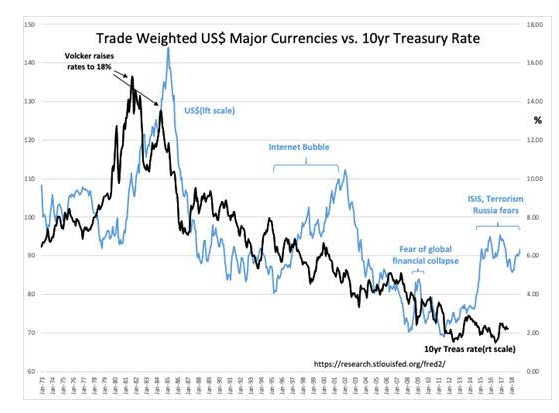
The data history Trade Weighted US$ Index Major Currency vs. $WTI Crude Price and Trade Weighted US$ Index Major Currency vs 10yr Treasury Rate cannot be separated from the underlying fundamentals, geopolitical policy shifts and advances in technology. This data reflects a rich history of our Human System with thousands of imperfect short-term decisions which seem to workout over time. It is a history with a very optimistic direction even though there have been many periods in which it did not appear so. Cultural bias in capital allocation even though stronger today than in previous decades can be seen as operative even 40yrs or so ago. The effect appears not as large today with the European Union as an alternative investment opportunity not available previously. The first evidence in this data occurs in the early 1980s but as noted by Adam Smith in “The Wealth of Nations”, 1776, investors have always sought out the best risk/reward opportunities.
In the early 1980s, with inflation raging and Fed Chairman Volcker took extraordinary action to quash 1970’s raging inflation. He raised rates, which had been lower than inflation, to 18%, well above the 12% inflation. Global capital surged to US markets to such a degree that the US$ soared more than 50% (from 85 to 145) in ~3yrs. The US$ kept rising even after the first rate rise in March 1980. Volcker on finding he had not effected a sufficient response to lowering the inflation, raised rates even higher May 1981. The US$ peaked March 1985. Inflation ebbed and global capital gradually rebalanced such that the US$ returned to its long-term trend in 1987.
The next significant shift in global capital began shortly after the beginnings of the “Internet Bubble”. Even though the Internet Bubble” peaked in 2000, the US$ did not peak till 2002. Eventually the US$ returned to its long-term trend several year later, Oct 2007. The US$ next had a short-term rise in 2008 as the “Sub-Prime Crisis” unfurled and investors sought a safe haven, briefly returned to trend in 2010-2012, but began to rise once again as ISIS terrorism forced displaced populations into Europe. Investors again sought safety in US$ assets. An additional and sharper rise occurred when Russia invaded Ukraine in 2014. With the current administration’s policies re: Iran, No Korea, Russia and China, the US$ has maintained these levels.
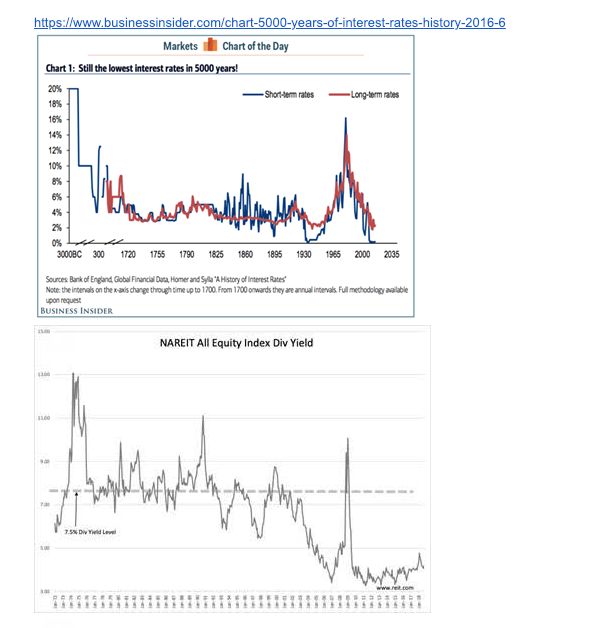
While some of the global capital shifted to the US has likely found its way into US equities, as US equities have out-performed other markets, it has been US fixed income and real estate which have witnessed bubble-like pricing. US$ 10yr Treasuries reached their lowest rate ever recorded, 1.37% on July 5, 2016 such was the influx of capital. Historically low Treasury rates have been identified as non-economic by experienced Value Investors. The 5,000yr history(Still the lowest rate in 5,000 years!) shows that ~4% rates have been typical. US Value Investors seek returns above these levels.
Newly wealthy investors of developing countries carry a different perspective and have favored US Treasury debt and real estate. One knows this by studying the basis of their investment behavior. For them safety of principal means having wealth safely away from their native government’s manipulation of currency and theft of assets. With globalization, the US and Europe have been the preferred destinations with their protections to property rights. Developing/Emerging market investors receive gains simply for being in US$ assets as one’s own currency deteriorates. The other favored asset is real estate. With safety being the primary driver, US Treasury rates and REIT dividend rates(NAREIT All Equity Index Div Yield) have been driven to atypical lows. There have literally been hundreds of stories of Russian, Chinese and other foreigners buying real estate as an investment in the major Western metropolitan centers. Asset prices have been driven well above historical levels. Known Value Investor Sam Zell calls the current pricing a ‘Real Estate Bubble’: https://www.valuewalk.com/2018/04/sam-zell-bubble-real-estate/ The same perspective indicates have been and remain in a ‘Treasury Bubble’. There has been enough global wealth creation brought about by globalization the past 25yrs to flood existing Western investment markets with capital seeking safety over return.
https://www.businessinsider.com/chart-5000-years-of-interest-rates-history-2016-6
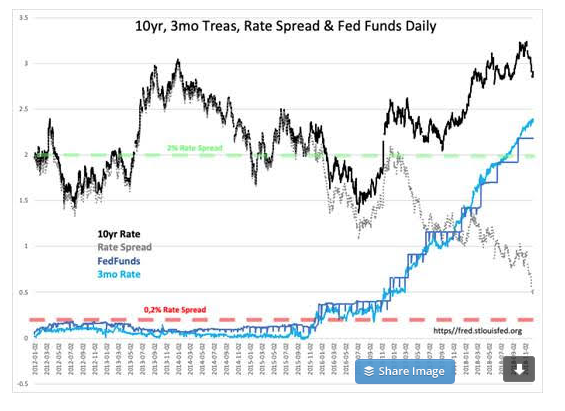
The consensus believes the market somehow has a set timeframe and that a market peak leading to an economic corretion is somehow “due”. Russia has taken this period of uncertainty to accost Ukraine’s naval forces, Putin having been out of the media suddenly brags he has weapons beyond any known capability and Iran launches a missile to let it be known it can attack Europe. The net/net is a stronger US$ and lower 10yr Treasury yields as more global capital flows into safe havens. Oil prices, which have been tied to algorithms with lower prices correlated to a weaker global economy and a stronger US$, have plummetted(Trade Weighted US$ Index Major Currency vs. $WTI Crude Price). This is a classic misinterpretation by Momentum Investors in my opinion.
BUT THIS TIME IS DIFFERENT!
What appears confusing the 10yr Treasury rates falling while the T-Bill rates are rising. This is historically atypical. Normally, market tops are characterized by rising rates at all maturities as capital shifts into equity(and other opportunities) with T-Bill rates rising faster than 10Yr Treasury rates. This has always been coupled to rising equity prices. As investor optimism shifts to extremes, T-Bill rates narrow the gap with the 10yr rates and bank lending stalls which inturn stalls economic trends and those too far extended are forced into default. An economic correction follows ususally within 12mos-18mos. The key point to note this time is that 10yr rates are falling as T-Bill rates rise. Value Investors are selling T-Bills to take advantage of low equity prices in a strong economic trend while foreign investors are continuing to seek a safe haven with global geopolitical concerns still unresolved. Algorithms tied to the yield curve spread, the US$ and oil prices simply kick in selling programs and selling-short without any reference to economic fundamentals.
Fundamentals of employment, Retail Sales, Job Openings, the Chemical Activity Barometer(CAB) and other reliable economic measures remain in uptends. The Momentum crowd has opted towards pessimism missing the facual information that fundamentals do not support the direction algorithms have taken. There is much to understand with a long-term perspective that is not identified by a few algorithmic connections. This is a momentary pause within the context of a continuing economic upcycle in my opinion. There is no ‘egg timer’ on this market.
Investors should add to portfolios!!