Rate fear is rampant but misinterpreted as usual. If one reviews history, 10yr rates always rise with rising investor optimism. That is, rates rise with increasing equity prices. This occurs as investors shift capital from fixed income, viewed as a safe haven, to equities as optimism for economic expansion improves. A more useful indicator, better than the 10yr Treasury rate, is the ‘Yield Curve’ which has been historically defined as the 10yr minus the 3-month Treasury rate.
When one views rates as a measure of market psychology i.e., optimism vs pessimism, and removes rate levels out of the realm of economic impact and into the realm of investor attitudes, interpretation becomes closer to making commonsense rather than seeming to be more of an economist guessing game. Viewing rate changes as capital shifting asset classes is the better route to understanding.
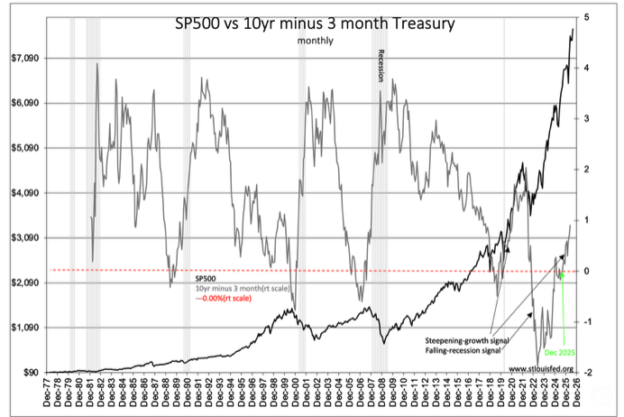
What occurs when the Yield Curve rises is that the investor long-term economic perception is improving. They are shift capital into equity exposed positions to benefit. That is, they sell bonds to buy stocks. However, while doing this, they also continue holding some capital in reserve, safely in T-Bills(3month Treasuries), just in case their perceptions are incorrect. If perceptions of economic expansion are supported, they keep shifting more capital into equity exposures and longer-dated rates continue to rise. In recent cycles, the spread of rates between the 10yr and 3-month has hit 3%-4% such has been investor enthusiasm. Currently the Yield Curve has a spread of 0.70-0.75%.
That the Yield Curve serves as a market sentiment measure is seen in its spread rise and fall in correlation with the SP500. Fear of recession drives the 10yr rate lower faster than the 3month and the spread declines. Declines in the spread are reflected in the SP500 prices. Economic optimism widens the spread and is correlated with higher SP500 pricing. Market tops are characterized by investors being overly optimistic to the point that they no longer wish to hold reserve capital. At this point they shift funds out of T-Bills in preference to own more equity type positions. This drives the spread ever lower during periods of excess speculation. When the spread falls below 0.0% is a typical signal of investor over-commitment, equity market tops and recessions ensue. One can also see market sentiment playing out in Retail Money Funds. Retail Money Funds peak in correlation with the perceptions that recessions have ended. A similar correlation is present with the manufacturing PMI which defines the PMI solidly as a market sentiment rather than an economic measure(not shown here).
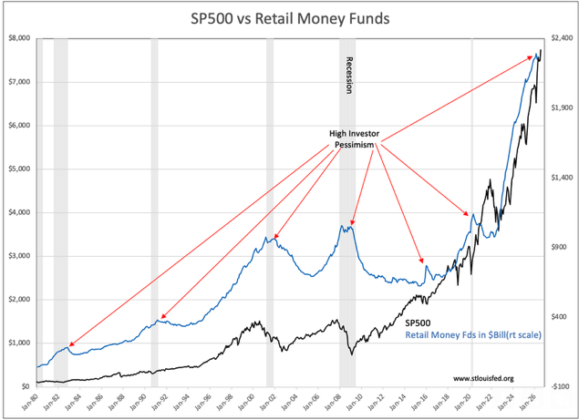
In our current environment, the spread is well under past periods of perceived economic expansion. That is, we see 0.70-0.75% spread when historically full-on investor perception of economic growth has spreads in the 3-4% range. Likewise, Retail Money Funds are only now peaking which indicates that retail investors are only now in the early stages of shifting capital into equity exposures. Retail investors hold $2.2+Tril in short term capital. In the past. 30-50% of this capital has shifted into equity exposures with the shift dependent on how long economic expansion occurred and how optimistically the financial media promoted investment.
Current investor sentiment and capital positioning indicate we yet have a few years of positive equity prices ahead. How high, how long this will continue will depend on investor sentiment. How high the rates go will not prove a near term deterrent as we have had much higher rates in the past with periods of healthy economic expansion. At the moment, the consumer is not stretched. When that occurs will be the time of concern.
Rate fear should be ignored. As long as investors(and consumers) can meet obligations and not be caught by financial difficulties, equity markets will continue to rise in response to current government policies.