This is great….
Tag: davidson
From the man who at the end of March emailed me and said “I am all in” ……..what a call.
From the man who at the end of March emailed me and said “I am all in” ……..what a call.
Take them for what they are, at least we know someone will be at the top of this list in term of accuracy and their opinion then given more weight. More importantly, we’ll know who to ignore…
Take them for what they are, at least we know someone will be at the top of this list in term of accuracy and their opinion then given more weight. More importantly, we’ll know who to ignore…
You know the saying. Those who buy the “hot trend” do so eventually hoping to sell to the greater fool. In the case of the dollar trade, the greater fool would be the last guy to short it before the rebound.
You know the saying. Those who buy the “hot trend” do so eventually hoping to sell to the greater fool. In the case of the dollar trade, the greater fool would be the last guy to short it before the rebound.
This is a follow up to a previous post:
“Davidson” is back with some thoughts on the USD/Euro..
“Davidson” is back with some thoughts on the USD/Euro..
Davidson” submits:
With the 2007’s Total Mortgage level over $14.5Trillion of which more than $11.1Trillion were home mortgages it would be hard to find a stronger connection to the financial system than this. Data from US Census Bureau most current information.
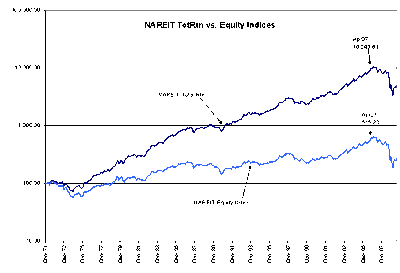
Equity REITs are publicly traded investment vehicles which use mortgage debt in the purchase of investment properties and form the REIT asset class that is used as part of your balanced portfolio. The market capitalization of the Equity NAREIT holdings has grown from 1972’s year end $332Mil to 2007’s year end $288.7Bil. This ~870 fold increase results from a combination of growth and increasing holdings from 12 REITs at inception and to 118 REITs at the end of 2007. Data from http://www.reit.com. At the end of 2008 the Equity NAREIT market capitalization had fallen to $176.2Bil. A comparison of the NAREIT Total Return vs Equity Indices in Chart 1 makes clear that ~94% of returns are derived from dividends which in turn by law are 90% of FFO(Funds From Operations).
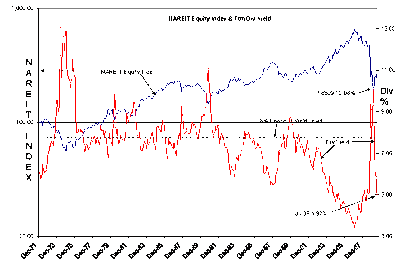
Chart 2 of the NAREIT Equity Index vs. Ttm(Trailing12mos) Dividend Yield shows that the dividend yield which had held in the 6%-9% for much of the period fell almost to ~3% in 2007 during a period of low cost mtg funding. The subsequent correction of 2008-2009 forced dividend yields to 10.08% in Feb09 which was at a historically high level and was a signal that the Return/Risk had become attractive. The recent fall in dividend yield to July ‘09’s 4.92% is a function of recent changes in the tax law that currently permit REITs to issue stock in lieu of cash which increases their financial flexibility. This change is expected to be a temporary forbearance, a bridge during the current economic period. Most expect regular 90% dividends to be paid in cash once this difficult environment has moderated.
My view is that these dividends will return although it is difficult to predict their timing and their magnitude till there is greater clarity. I continue to recommend REITs as an attractive allocation in balanced portfolios with a strong preference for Global REIT exposure.
Disclosure (“none” means no position):
Philadelphia Fed’s Bullish Report
“Davidson” submits:
The Philadelphia Fed report on the business outlook survey has startled Wall Street and set abuzz chatter regarding the long forecasted V-Shaped Recovery by Wesbury. This report was so far better than expected 4.2 vs. an expected -0.2 that Treasuries fell in value as investors sold to buy stocks. The report can be accessed at the URL here and I have presented the relevant chart below.
The market is if anything anticipatory. On CNBC @4:30PM yesterday John Herrmann of Herrmann Forecast LLP commented that he expected the Sept. Purchasing Managers Index(PMI) to show new orders up dramatically to ~59% level.
It would be convenient if investing could be so simple that we could take these pieces of information and invest with confidence into just the right sectors and asset classes. But, the markets are anything if convenient and predictable. While the Return/Risk appears to favor many asset classes, approaching the market with a balanced portfolio has always proven in the long run to have been a prudent strategy. There is always present no matter how bullish the news seems to be developing the significant uncertainty of unseen events. We always know what we would like to have as a return, but we can never know when an unpredicted event will spook the market confidence and implode our short term needs.
Disclosure (“none” means no position):
Philadelphia Fed's Bullish Report
“Davidson” submits:
The Philadelphia Fed report on the business outlook survey has startled Wall Street and set abuzz chatter regarding the long forecasted V-Shaped Recovery by Wesbury. This report was so far better than expected 4.2 vs. an expected -0.2 that Treasuries fell in value as investors sold to buy stocks. The report can be accessed at the URL here and I have presented the relevant chart below.
The market is if anything anticipatory. On CNBC @4:30PM yesterday John Herrmann of Herrmann Forecast LLP commented that he expected the Sept. Purchasing Managers Index(PMI) to show new orders up dramatically to ~59% level.
It would be convenient if investing could be so simple that we could take these pieces of information and invest with confidence into just the right sectors and asset classes. But, the markets are anything if convenient and predictable. While the Return/Risk appears to favor many asset classes, approaching the market with a balanced portfolio has always proven in the long run to have been a prudent strategy. There is always present no matter how bullish the news seems to be developing the significant uncertainty of unseen events. We always know what we would like to have as a return, but we can never know when an unpredicted event will spook the market confidence and implode our short term needs.
Disclosure (“none” means no position):
“Davidson” Submits:
Subject: Dallas Fed Releases Updated 12mo Trimmed mean PCE Inflation benchmark.
The Dallas Fed released their 12mo Trimmed mean PCE inflation benchmark this morning. This includes the Jun09 and July09 values and was delayed while they went through a periodic review. It should be no surprise that the values are lower as this indicator carries an estimate for cost of housing as well as energy and food. This index “trims” monthly spikes, but includes all relevant expenditures as opposed to earlier “Core Inflation” which simply excludes food and energy components.
This is in a favorable direction for market valuations. My analysis uses the long-term Real GDP trend of 3.15% and adds the 12mo Trimmed mean PCE to produce the Market Capitalization Rate(MCR). This value then is calculated with today’s release to be 4.85%. This then becomes the means of valuing whether the market is over/under priced all things being equal and the same can be said of individual stocks and bonds.
For Treasuries this becomes a simple calculation. One simply takes the 10yr Treasury Yield which today is ~3.46% and by comparison it is simple to see that the general economy should produce a higher return than 10yr Treasuries. The lower 10yr Treasury Yield is because of the risk investors perceive in alternative choices.
There is not enough space this email to detail the analysis of the SP500, but mean estimated earnings are currently $64.50(3Q09) and as I write this the SP500 is priced at 1030. The Earnings Yield of the SP500 is calculated simply by dividing est. earnings by the current price or $64.50/1030 = 6.26%. This is a simple methodology and all the inputs can change over time, but the process produces a relative return comparison that is simple to use. To convert this into a estimate for the SP500 price target one divides the SP500 Earnings Yield by the MCR, 6.26%/4.85% = 1.291 or 29.1% higher. This means that all things remaining equal the SP500 has the capacity to rise to ~1330 IF earnings were to be at median level today and IF investor psychology normalized. Note: If inflation changes so does this number which can dramatically change market pricing. Lots of “IF’s” here but this is how the market works. We can only make estimates and can never make guarantees.
The calculation uses a normalized or mean earnings estimate because the basic assumption is that the companies in the SP500 are expected to recover as they have since 1930(79yrs of economic and investment history). There is nothing that I can see in our current situation that would suggest that a recovery would be impossible. If something should suddenly become apparent that our Free Market Economy had been injured by unthinking government action, then we would have to revisit all assumptions. But, even with all the issues being discussed today which seem potentially injurious to our economy, history shows that sparring political parties generally compromise without major damage to our economy.
This Dallas Fed release makes allocation to stocks and corporate bonds quite favorable at this time.
Disclosure (“none” means no position):


