“Davidson” submits:
CALSTRS is a short term trader when its obligations are long term (see this article).’ Short-termism’ comes from how you define ‘risk’. ‘Short-termism’ is the problem. Since Harry Markowitz’s Modern Portfolio Theory in 1955, the world has defined ‘risk’ as short-term volatility and completely lost track of a long term view of asset growth and risk defined as a long term loss of capital. By falling into ‘Short-termism’, investment committees could respond to outside criticism by showing that they were making appropriate adjustments within a mathematical model that neither they nor the critics understood, but all could claim were using the best known methods at the time. They kept their jobs.
By having a long-term view as I do, as do many Value Investors, you see long-term fundamentals trending through a lot of market psychology pricing noise. There are only a relatively few Value Investors, but they see the capitalization valuation benchmark as roughly our GDP growth rate. I am the only one who has crafted a device like the SP500 Intrinsic Value Index ($SPY).
The reason why I am the first is simply a combination of serendipity, persistence and a strong sense of the value numbers convey( from my scientific background). The serendipity part of the equation rests on the development of the Internet which led the St Louis Fed to provide free public access to multiple government economic data series it had internally in 2005. The St Louis Fed has since expanded from a couple of thousand data series to something over 260,000 data series, a good number of historical discontinued series and many current global series. I had already created the SP500 price and eps history from 1926 manually typing into Excel from SP500 data taken from the S&P Blue Books I found in a research library in 2002. The US economic data which I discovered shortly after the St Louis Fed began to offer it was a gold mine as it let me conveniently mix and match to test what was consensus and then to find what I found were more relevant correlations. Knowing that the ‘numbers’ were derived from a ‘human system’ at the start, I never went the mathematical route in my analysis. I knew that the data values incorporated market psychology and that the only trends one could trust were ones which were mentally adjusted for the psychological impact. This meant trusting trends drawn by hand on semi-log charts and looking long term enough to wash out the impacts from market psychology.
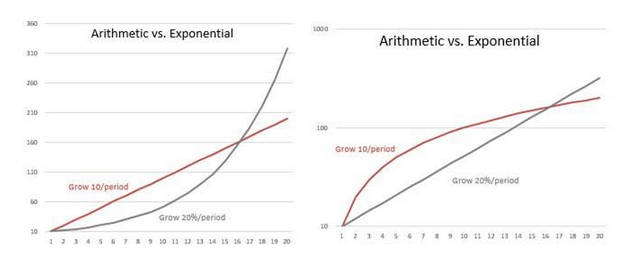
Most today fail to see that drawing trends using arithmetic charts that they are measuring growth the wrong way. The charts below show how charting like this leads to incorrect conclusions. The chart on the left is arithmetic while that on the right is exponential(semi-log). The RED line is calculated beginning with a value of 10 and grows by adding another 10 units each period (y = mx + b data(m=10, b=10). On an arithmetic chart this produces a straight line, but on the exponential chart it produces a slowing curved line. This is so because adding the 1st ’10 units’ doubles the starting amount, but the 2nd ‘10 units’ is now added to 20 which is only 50% growth and the 3rd ’10 units’ added to 30 which is only 33% growth. Each additional ’10 unit’ addition represents slower growth on the base number which keeps rising as the additions remain the same. Plotting this type of falling growth sequence in an arithmetic chart produce a straight line. Only in an exponential chart does diminishing growth show up as the diminishing curve you see. Yet, most Technical Analysts use arithmetic charts draw their lines and call this ‘growth’. The DARK GRAY line is true growth of 20% per period and shows up as what many know as an exponential curve in the arithmetic plot and a straight line in the semi-log plot. Semi-log plots are the only way one can visually see growth and draw the trends in stock price data.
That is your math lesson for the day.
I am lucky to be able to have the perspective I do because of how events have played out for me. Once I finish my book, I hope to get the world to see markets very differently. We are a human system. Every day we strive to improve our condition and make a better world for our children. Every day we strive to make our system fairer. Yet, there remain many detractors who just do not understand how this all works and prefer to dictate against businesses as ‘evil’. Profit is the basis for GDP, for Money Supply, for improvements in our standard of living and poor politically motivated government decision making is responsible for inflation. If the CALSTERS people had a better view with which to guide their efforts their thinking would not be subject to ‘Short-termism’.
I am 90pgs along at the moment. I expect it to be ~250 pgs with many charts to explain concepts and dispel currently accepted myths. I expect once I have finished the 1st draft that it will take a couple of years of editing. I am thinking of beginning it with “I, Pencil” by Leonard Read which is a great piece about how we work together in very wide spread coordinated behavior to produce something as simple as a pencil with everyone involved making a profit.