Please do yourself a favor. When presented with housing data, ignore anything that compares consecutive months figures, it has little meaning as there are huge seasonal reason for variations.
What you must compare to get the real picture is month to month over the previous year. With that being said (bold emphasis mine):
IRVINE, Calif. – April 16, 2009 – RealtyTrac® (http://www.realtytrac.com/), the leading online marketplace for foreclosure properties, today released its U.S. Foreclosure Market Report™ for Q1 2009, which shows that foreclosure filings — default notices, auction sale notices and bank repossessions — were reported on 803,489 properties in the first quarter, a 9 percent increase from the previous quarter and an increase of nearly 24 percent from Q1 2008. One in every 159 U.S. housing units received a foreclosure filing during the quarter.
Foreclosure filings were reported on 341,180 properties in March, a 17 percent increase from the previous month and a 46 percent increase from March 2008. The March and Q1 2009 totals were the highest monthly and quarterly totals since RealtyTrac began issuing its report in January 2005 despite a decrease in bank repossessions (REOs), which were down 13 percent from the fourth quarter of 2008 and 3 percent from February totals.“In the month of March we saw a record level of foreclosure activity — the number of households that received a foreclosure filing was more than 12 percent higher than the next highest month on record. Since much of this activity was in new foreclosure actions, it suggests that many lenders and servicers were holding off on executing foreclosures due to industry moratoria and legislative delays,” said James J. Saccacio, chief executive officer of RealtyTrac. “It’s also likely that the drop in REO activity can be attributed to these processing delays, rather than to any of the foreclosure prevention programs currently in place. It’s very likely that we’ll see the number of REOs increase again now that most of the moratoria have been lifted.
“On a positive note, it appears that demand is up in some of the harder-hit areas, particularly on bank-owned REO properties that first time homebuyers and investors see as bargains,” Saccacio continued. “But it’s unlikely that this increased demand will be enough to offset the growing number of foreclosures in the pipeline, accelerated by rising unemployment rates.”
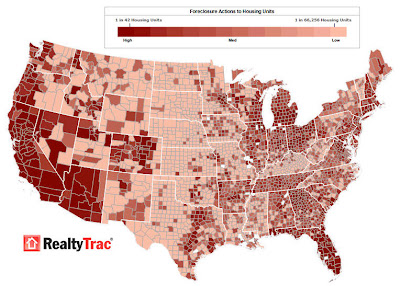
Here is the Q1 foreclosure Map:
Yes I know that 60% of all foreclosures are in 5 states. I also know that a great deal of US economic activity comes from those areas, not good. Let’s also not forget that in many of those 6 states there was a foreclosure moratorium that only ended in April which skewed Q1’s results. It also means we ought to see an onslaught of activity in April that causes Q2 to really scare people.
Bottom line is that there is no stopping the housing free-fall yet. It may be slowing somewhat, but that is it.
Yes I also have seen the stories about “bidding wars” in some areas for homes. Here is the thing about that. These “bidding wars” are for select homes that are selling for 50% less than they sold for just a few years ago. This is not good. It also goes to the point that if we have to search for the occasional bidding war, it means there are not very many of them and if that is true, we have not seen the bottom in housing yet.
Remember, we have a year’s worth of new homes sitting on the market, empty. The scattered “bidding war” for a home with a 1/2 off sale doesn’t do anything to make me believe this slide has ended or will end anytime soon. now, it will slow the slide, but it will not stop it….not yet..
Disclosure (“none” means no position):
2 replies on “More Cold Water for Housing”
Good analysis and an eye opener on what is really going on.
thank you