“Davidson” submits…
The market watched with great anticipation yesterday for the decision on the level of the Federal Funds Rate from the Fed’s Open Market Committee meeting yesterday. There were many forecasts provided earlier this week by multiple pundits and in the end the Fed Funds Rate remained unchanged.
In my experience having seen what seems to be endless Fed Funds Rate forecasts, 5 true recessions, multiple market scares, 3 major real estate bubbles and multiple bubbles of various colors and magnitudes, it has never appeared to me that the Federal Reserve actually ever used rates preemptively except once. The one time the Fed actually initiated a rate change to implement a major policy was in the early 1980’s when Paul Volcker acted to quench the rampant inflation focused spending psychology that was threatening to destroy the US financial system. Since then, my experience leads me to the conclusion that rates are set by markets and the economy. The Fed acts well after the barn door has been opened.
The concept that the economy tends to have an automatic rate setting mechanism has a long history that seems to have been lost in modern thinking. Knut Wicksell in 1898 formalized the concept of “Cost of Capital” being market driven by Supply/Demand dynamics. He is called the “Father of Modern Monetary Policy”. But, Adam Smith in his 1776 “The Wealth of Nations” provided many examples demonstrating how the cost-of-capital and returns-on-capital were market driven.
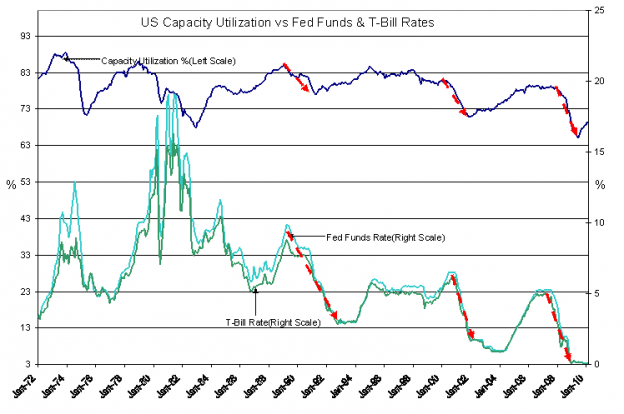
The chart below of US Capacity Utilization vs. Fed Funds & T-Bill Rates illustrates this point. RED ARROWS identify the declines of US Capacity Utilization and interest rates.
The Business Cycle has “Ebbs” and “Flows” a fact of which we are all aware. During the “Flow” part of the cycle employment is high, capital turnover is high in the form of goods being actively manufactured, bought and sold. The supply chain for goods to consumers requires capital to originate raw materials and turn these into consumable products. This is a period of high demand for capital. But, once the needs of society have been supplied, society tends toward excess production which creates more Supply than there is Demand. The typical result is an inventory of unsold goods and the supply chain is forced to slow. The US Capacity Utilization declines, RED ARROW and unneeded capital moves out of the supply chain and into T-Bills forcing rates down-RED ARROW (See chart).
Society then goes through a period of higher unemployment and inventory reduction till a basic level of consumption is reached. This is the “Ebb” part of the cycle. Most individuals will go to extraordinary lengths, i.e. spend savings, charge spending to expensive credit cards and borrow from relatives, to maintain a consumption level that sustains basic standards of living. This means that individuals will still make basic repairs to an automobile so that one can get to part-time/alternative employment to maintain minimal income needs. (This is why auto-parts companies are counter recessionary investments) Once the inventory has been sufficiently reduced, the business cycle is resurrected by a continuous growth of the population and capital becomes reabsorbed by the supply chain thus raising interest rates and US Capacity Utilization. You may add the GREEN ARROWS yourself where a rising US Capacity Utilization is associated with rising interest rates.
It has always appeared to me that the Federal Reserve raises or lowers rates to follow the trend of rates in T-Bills. I do not expect the current situation to be any different than what we have seen historically. That is why I believe a rise in T-Bill rates from the current 0.16% is a useful forecasting tool for the economy and investment markets.
Should you want to track T-Bill rates, the CBOE provides a generic 13wk T-Bill Rate Index with the symbol IRX. On Yahoo Finance you have to use the symbol “^IRX”. Today’s level has been between 1.6-1.5 which equates to 0.16%-0.15%.
