“Davidson” submits:
Over the years I have developed a distinctly different view of the investment markets than that which is taught and currently used so publicly proffered in the media. I have put together a presentation from which I pulled 3 slides which help to summarize my “A Simple Market View”. The approach I use looks at the market with the perspective of the business cycle which can last 5yrs+ and which has identifiable economic and valuation trends that can be used to guide one in making measured and thoughtful decisions over the cycle. The express goal is to avoid making the impulsive decisions so actively promoted in the media. I call this perspective the Business Cycle Value style (BCV).
Understanding BCV begins with understanding that the markets and in particular the SP500 are not monolithic but a composite of influences. The monolithic view comes from the many mathematicians who have come to dominate the realm of finance the past 100yrs with the first foray by Louis Jean-Baptiste Alphonse Bachelier (March 11, 1870 – April 28, 1946) who equated equity markets to the random movements of pollen grains being peppered by air molecules called “Brownian Motion”. Since that time, mathematicians have grown in their dominance of market study evolving into “Modern Portfolio Theory” by Harry Markowitz in 1952, the “Efficient Market Theory” by Eugene Fama in 1970 and the “Black-Scholes Formula” by Fischer Black and Myron Scholes in 1973. The net/net result was an ignorance of the fundamental economic inputs to market and equity prices fostering the belief that markets were too difficult to parse. Today, we have wide investor acceptance of a host of hedge funds whose capital allocations are based on price momentum and proprietary algorithms without even knowing the names and businesses of the equities in which they have invested.
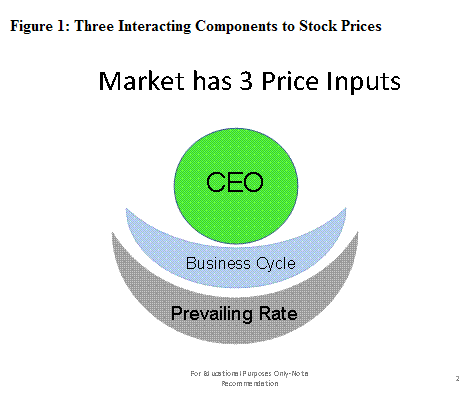
“A Simple Market View” is a revival of a combination of fundamentals both “Top-Down” and “Bottom-Up” which blends basic equity research with the business cycle and broader economic valuations to produce the BCV. Three market price inputs can be seen if one looks close enough. The first is the influence of the CEO to equity prices and referred to as the “Bottom-Up”. However, the actions of the CEO influence nestles within the price inputs of business cycles which in turn nestle in the influences of the price inputs of broad economic trends as shown pictorially in Figure 1. By parsing each price influence, one can make sense from what appears to be complete nonsense.
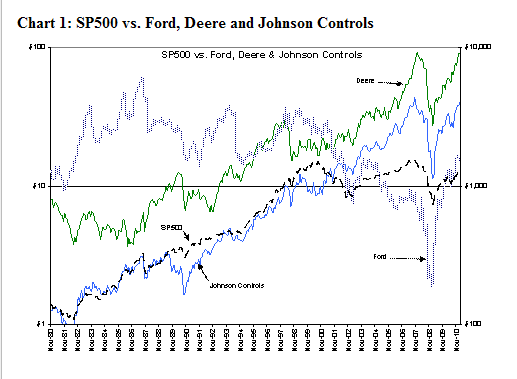
“Bottom-Up” equity analysis is geared towards identifying which companies have the better CEOs. CEOs set the business cultures of their respective companies, how much leverage is used, how well they anticipate business cycle expansions and contractions, product quality, employee productivity and a multitude of other factors that shape long term corporate performance. The importance of the CEO is reflected in Chart 1 which compares three companies, Ford, Deere and Johnson Controls, with the SP500. These three companies operate within a very cyclical automobile-truck-farm equipment industry yet have had very different outcomes for investors and subsequently their inputs for the SP500. The differences are dramatic! The SP500 from June 1982-Present has grown by a factor of 12.3 (1130%) while Ford by a factor of 1.18 (18%), Deere by a factor of 22 (2100%) and last but not the least Johnson Controls by a factor of 40 (3900%). The better CEOs out-perform the SP500 handily which is a non-selective composite.
CEO skills range across a wide spectrum. BCV style recognizes this and does not view the market thru the lens of sectors. There are often only a couple of CEOs worth investing in when conditions justify in any single industry. BCV results in investment CEO by CEO as valuations justify. As a by-product the better CEOs provide a significant source of market insight thru their annual letters to shareholders, quarterly earnings calls and interviews to the media which can be used in the process of managing a portfolio. They are so helpful in this regard that I some times refer to them as “My Staff”. This source provides me with as many as fifty investment insights each day.
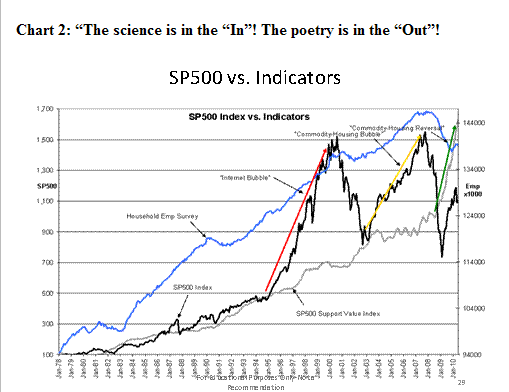
Ian Cumming captures his entire investment style in this one simple quote, “The science is in the “In”! The poetry is in the “Out!” Cumming’s investment record is represented in Leucadia’s (NYSE-LUK) price history which one can easily find if interested. This is the basis for Chart 2. Chart 2 combines the SP500, the Household Employment Survey and my SP500 Fair Value Index. One can see that the business cycle, using the Household Employment Survey as a proxy, has highs and lows that coincide with that of the SP500. One can also see that the SP500 lows correlate with the SP500 Fair Value Index. There is quite a lot going on in Chart 2 which makes is useful to break the discussion into two sections.
The SP500 Fair Value Index is derived from the “Prevailing Rate” which is used to “capitalize” the long term earnings trend of SP500. In this index one takes the long term earnings trend and uses a capitalization rate called the “Prevailing Rate” which is calculated by combining a factor from the long term Real GDP and a relevant inflation factor. In this work the Dallas Fed’s 12mo Trimmed Mean PCE is the inflation factor used. A critical difference in this work is that the cyclical earnings of the SP500 is ignored so that when making investment decisions one is not relying on near term earning’s highs or lows but on an estimate of earnings 5yrs+ into the future. In this fashion one can elect to not “Over Pay” at market (economic) tops while at market (economic) lows one can elect to pay for future earnings since one is not relying on the near term earnings performance that drives much of today’s investment decision making. This is the “science” of Cumming’s quote and the basis of good value investing in BCV. The SP500 Fair Value Index is a level attractive to the BCV investor and is where the SP500 finds investor support.
Inflation has a significant influence on the SP500 Fair Value Index with today’s 0.8% 12mo inflation rate priced at ~1600. The market is significantly under-valued should inflation remain this low, but Fed actions towards cheap and readily available money may cause inflation to rise. Inflation is in my view a psychological mindset. It is as unpredictable as market psychology and the best I think that can be done is to monitor its impact monthly and take appropriate action when excess occurs.
At the moment, the market based on current readings is excessively under-valued.
Using the Household Employment Survey and other economic data series one gains an appreciation of the influences that cause the market to soar upwards from the SP500 Fair Value Index. I interpret the market highs coinciding with employment peaks as symptomatic of many investors’ belief in the concept of “The Invisible Hand” or Fama’s “Efficient Market Theory”. This is the belief that the market prices all known information efficiently and at fair valuation. Any positive news concerning the economy or corporate earnings that had not been anticipated prices the market higher. Likewise, unanticipated negative news prices the market lower. Unfortunately, many market watchers react to every weekly and monthly data release as if the information is significant. Each release is read as trend-setting from the previous release when in fact most of these trends require not only at least 6mos of data in order to comprehend their importance but also viewed in comparison with trends from multiple data series. The end result is a market priced well above the SP500 Fair Value Index during economic up trends. The market is priced higher as long as the news is perceived as “Good”.
Periods of market over-valuation seem to dominate since the advent of significant influence of hedge funds in 1995, see Chart 2. With markets becoming routinely over-valued since 1995, this leaves one with a dilemma on deciding when to take profits without the occurrence of the proverbial “…leaving too much on the table!” The Household Employment Survey coupled with the pace of home and auto sales, the pace of rail and truck traffic, the occurrence of an inverted yield curve and other economic signals of slowing can serve as a guide. This is the “poetry” of Cumming’s quote. There has never been a valuation factor that has proved useful in identifying market tops. One must take a number of indicators into account when deciding to take prudent action and this amounts to one’s best guestimate!


