“Davidson” submits:
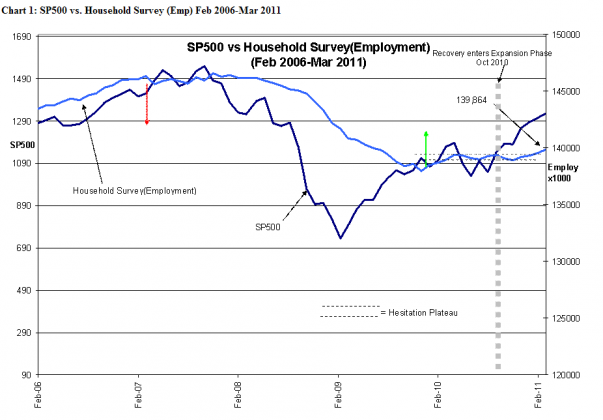
The BLS reported the Household (Emp) Survey at 139,864,000 or higher than the previous month by 291,000-see Chart 1: SP500 vs. Household Survey (Emp) Feb 2006-Mar 2011.
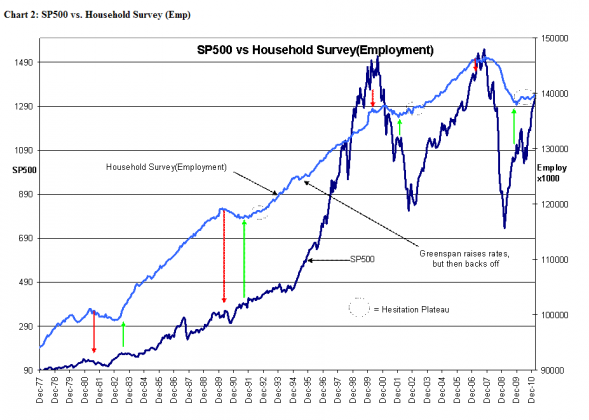
I interpret this as a solid upside breakout from the “Hesitation Plateau” that has appeared in previous recoveries-see Chart 2: SP500 vs. Household Survey (Emp) which covers the period from Dec 1977 to Mar 2011.
I interpret the “Hesitation Plateau” as reflecting an initial period of hiring by companies in the early stages of recovery, but then surges once the economy has moved into the expansion phase. The economic recovery entered expansion ~Oct 2010 when US Real GDP reached an all time high.
By looking at the SP500 one can see that market psychology began to turn more positive in Oct 2010 and it has continued to improve on today’s news.
Even with the early signs of inflation (Dallas Fed has issued a warning that inflation could move over 2% this year), equities tend to rise with improvements in market psychology which in turn trends with economic recovery and then economic expansion. There is a strong correlation between employment growth and SP500 performance as one can see in the charts below.
I continue to expect that the next few years should reflect a typical recovery which should carry equity prices higher.

