First half update:
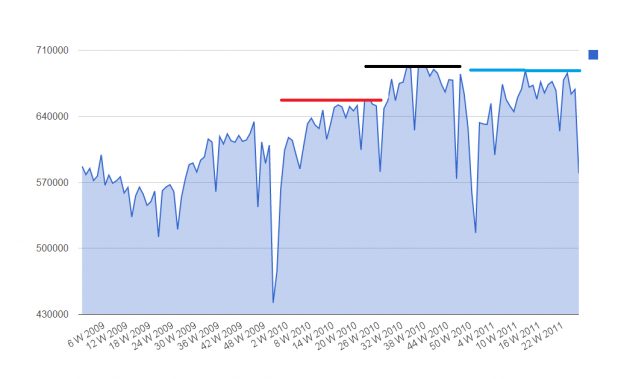
The red and blue lines represent the same period over the last two years. 1st half 2011 is ahead of 1st half 2010 and for continued growth, we need to see the 2nd half get above the 690k car highs of 2nd half 2010 (black line). We have come clkose to that # in the 1st half of this year but not eclipsed it.
When should we get worried/excited it either isn’t/is happening? Not for a few weeks yet. We should see a slow climb from here with large levels around weeks 32-36 (expecting a Labor Day decline). I am looking for levels in excess of 705K cars translating into 2.5%-3.5% Q3/Q4 GDP #’s. Variations above/below that will guide GDP expectation in a similar direction.
As for last week, all sector saw declines and all carries did also with only $KSU seeing a minimal decline ans $CSX saw the largest (in percentage terms). Interestingly, forest products saw a negligible decline. That is a direct building indicator but I am of the opinion that it may be more due to re-building post the abnormally large spring tornado season we saw than organic growth. Either way, it still means jobs and economic activity although not the way we’d like to see it happen.
Bottom line? I still think we see growth in Q3/4 better than Q1/2. Everything we follow is trending overall in that direction (ignoring weekly expected fluctuations and focusing on the major trends).
