We could just as easily add increasing housing starts also to this list. When our two largest industries, auto and housing are increasing, the rest of the economy will follow. When that happens, stock markets go higher. I have been reading more reports lately that the market is in a “bubble phase”. I rarely resort to simplistic verbal denouncements here but that talk is just plain stupid. We are not even “fairly valued” based on the S&P Intrinsic Value (currently 1,900) . the “bubbles” in the stock market in the 2,000’s exceeded the Intrinsic Value by 100% in 200o and 50% in 2007 during the housing bubble. That would give us values today of 3,800 for a year 200o style bubble and 2,850 for a 2007 style bubble (see this post).
Until the $SPY zips past 2,100 (assuming it does so in the next 6 months) let just put talk of a “bubble in stocks” to bed. People who are doing this are doing so by looking in the rear view mirror. The thinking is “the market is up 26%, it must be a bubble”. That type of thinking assumes the market, when it was 26% below the current level was actually valued accurately. Hint: it wasn’t. The market has grudgingly gained 26% this year despite a mountain of skepticism along the way. I mean, according to the lunatics at ECRI, we are in a recession. That hardly equates to the unbridled euphoria that accompany stock market bubbles.
This market has plenty of room to run before we can get serious about any “bubble” talk…
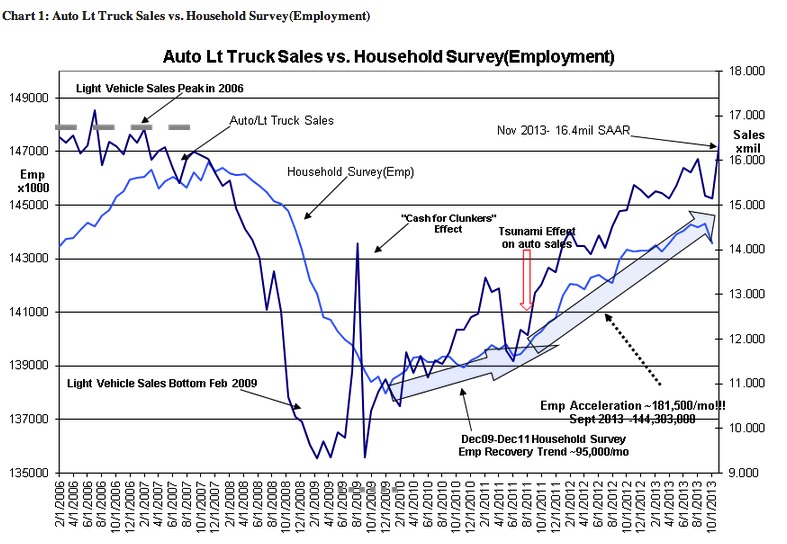
Light Weight Vehicle Sales are reported at 16.4mil SAAR(Seasonally Adjusted Annual Rate). Auto and Lt Weight Truck Sales data is a good forecasting tool for employment trends 9mos-18mos ahead. We should expect to see higher employment in the months ahead and higher stock prices. See Chart 1:Auto Lt Truck Sales vs. Household Survey(Employment)
The Light Weight Vehicle Sales trend reflects both general economic activity and the availability of credit. The economy becomes mostly a cash economy during the deepest months of recession. Gradually business confidence improves and at its peak we see lending to individuals who would not have qualified at market lows. Eventually lenders simply run out of individuals who qualify even for the loosest underwriting standards. Once this occurs, vehicle sales go flat and the last of those who were hired find that they are no longer needed. This leaves them with debts for homes and vehicles acquired when no one thought the economy would slow. They become the first to default and the economic cycle enters correction as all lenders pull back. Think of this as a long slow dance. Suddenly manufacturers recognize that there are more vehicles built than there are people to buy them. Lenders pull back suddenly because they suddenly recognize that the last year’s worth or so of lending is now at risk of default. Over use of debt makes and economic slow down much worse.
Because vehicle sales rely on credit and the use of vehicles is paramount in the US to hold or even improve one’s standard of living, this data series is one of the best in forecasting the direction of employment.
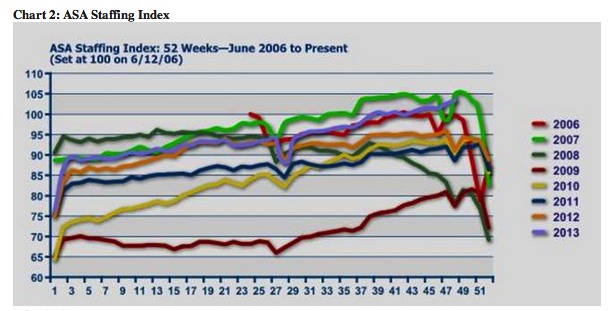
Also of note this week is Chart 2: ASA Staffing Index. What is unusual is that that there has not been the seasonal dip so typically seen at this time of year. I suspect that retailers have brought in additional staff to meet being open for Thanksgiving sales. Normally a sizable decline can be noted which matches Thanksgiving in previous years, but the 2013 data as shown in the PURPLE-BLUE LINE has continued without any perceivable decline. With more individuals working this likely represents higher personal income and better retail sales than have been predicted. Certainly, we have seen robust vehicle sales.
We have received excellent economic data the past few days. Expect the equity markets to proceed higher on these reports the next few months.