“Davidson” submits:
Economic activity always is a composite of moving parts. Currently it appears we have more moving parts than usual. Indeed so! We have multiple policy shifts in the works with the potential for beneficial outcomes. But, if these occur, it will be likely a couple of years before the final outcomes are known with the path uncertain.
Meanwhile, it is best to stick to long-term economic trends for which we have experience in assessing current and future expectations. There are several recent trend extensions which tell investors to hold the course.
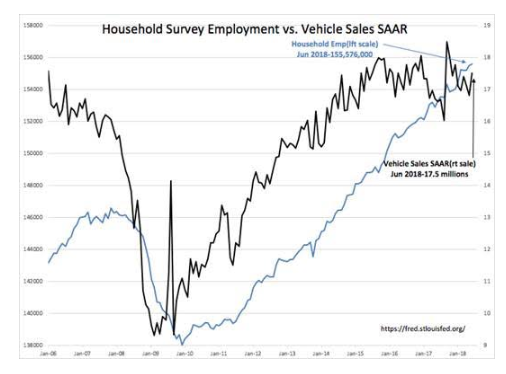
1st is this week’s employment and vehicle sales reports. The Household Survey reported an increase of 102,000 keeping the trend from 2009 intact. Vehicle sales SAAR(Seasonally Adjusted Annual Rate) are reported to be 17.5million and in-line with historical side-ways trend during mid-later cycle vehicle demand expectations. Good for a continued rise in general economic activity.
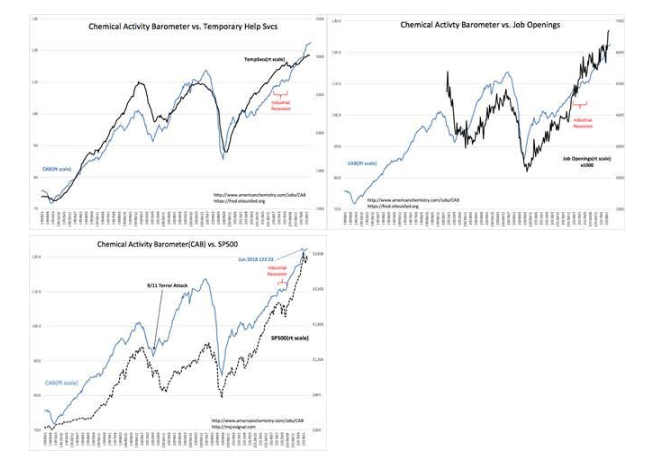
2nd. The employment and vehicle sales trends are supported by the Chemical Activity Barometer(CAB) and 2-precursors to employment called Temporary Help Svcs and Job Openings. Each reported new highs. The SP500 can respond to the CAB with a lag of 12mos+ which leaves us with the expectation that equity prices are likely to be higher the next 12mos+.
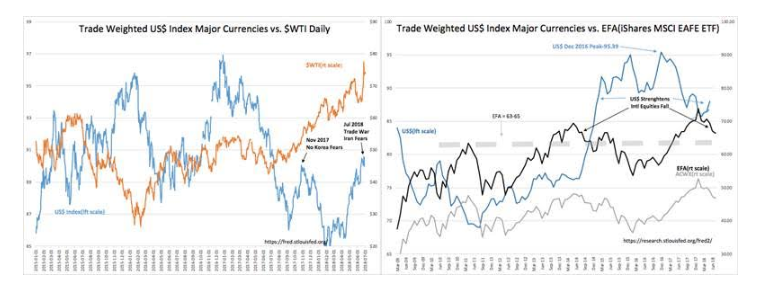
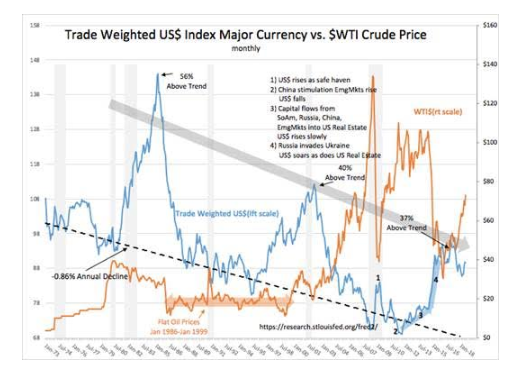
3rd there are US$(US Dollar) and oil price relationships. Even with the extensions higher in US economic measures, the policy shifts in process reveal market concerns globally. The two most prominent are oil prices($WTI) and the Trade Weighted US Dollar(US$). 3 charts shown indicate Daily and Monthly relationships for near-term and long-term perspective. Geopolitical initiatives to counter Russian, Iranian, No Korean, Venezuelan and Chinese threats to Democratic freedom of choice have resulted in higher US$ and $WTI. Higher oil prices arise from sanctions against Venezuela and Iran oil exports as a means of forcing compliance to the accepted rule of law. The rise in oil prices has occurred with a short-term rise in US$ which has since 2003 been generally inversely correlated by hedging algorithms. The recent rise in the US$ can be explained as a rising level of concern with global investors seeking the same safe haven as they did 2014-2016 on Russia’s invasion of Ukraine and the rise of ISIS. Having both oil and US$ shifting in the same direction is counter to existing algorithms and can produce unexpected volatility. The recent impacts for US investors include higher oil prices, lower Intl Equity prices and concerns about US exports. The inverse correlation of Intl Equity prices to the US$ is in the chart of the Trade Weighted US$ Major Currencies vs. EFA(iShares MSCI EAFE ETF).
Many take shifts in market prices as indicating shifts in economic activity. There are no signs that US or Global economic activity has shifted lower. The data continue to support global economic expansion in the face of temporary period of concern in market psychology. If the economic trends continue to generate positive headlines, market psychology has always followed.
The long-term US$ trend is a decline of ~-.86% Annually. The Trade Weighted US$ Index Major Currencies declines as a result of the US increasing its trading partners. Adding a trading partner raises the currencies of these trading partners. This process brings new currencies to this index and increased trade results in higher relative levels of these currencies to the US$. If the current policy initiative to lower global tariffs is successful, we should see the temporary strength in the US$ evaporate and the US$ to decline ~25% towards the long-term trend with trade expansion.
Much of the current hand-wringing concerning the US push to lower tariffs and reduce threats to Democracy is likely to be short lived in my opinion. While the level of the US$ has been elevated during periods of global geopolitical/economic stress, the easing of this stress is an investment opportunity. The US$ is ‘The Elephant in the Room’ and its normalization to the long-term trend would likely drive all equity prices higher.
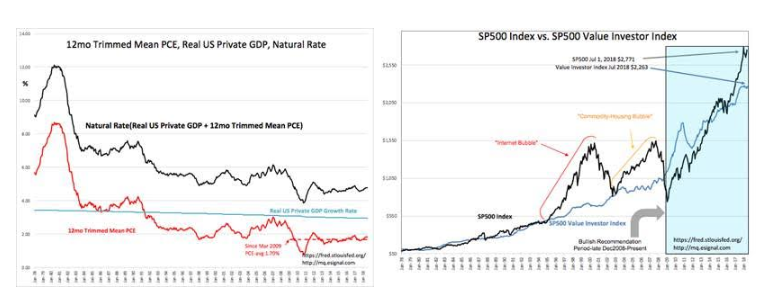
4th Lastly, but certainly not least, is inflation, that bug-a-boo nightmare beasty ready to jump out of the closet when least expected. The most recent read from the 12mo Trimmed Mean PCE is 1.84%, a little higher than the trend since 2009 of 1.70%, but well below current fears. My work couples this mostly to rise and fall in Govt Exp&Inv and not to any of the widely-held beliefs in commodity prices or changes in M2(Money Supply). The 12mo Trimmed Mean PCE is a factor for the ‘Natural Rate’(earnings capitalization rate based on Knut Wicksell-1898). The current SP500 level ~$2,750, is a 21% premium to the Value Investor Index. Higher inflation makes SP500 EPS worth less historically, but investors only pay attention to this at recession lows. The SP500 can easily rise to 100%+ premium to the Value Investor Index before we see a cycle peak.
The SP500 is modestly priced and market psychology as measured by the T-Bill/10yr Treasury Rate Spread(not discussed in this report) registers a mid-range historical level.
The recent US budget provided a substantial increase to US military spending. Historically, defense spending is the most inflationary. Thus far the current administration has been careful on wasteful over-priced spending. But, inflation is a lagging indicator, showing up with a lag of ~2yrs after government spending. This is something to be monitored and may have a impact on market psychology.
The Investment Thesis for July 2018:
We find ourselves in a period of multiple shifting policy themes any of which can result in significant investment outcomes. Thus far the data remains positive for longer-term higher equity prices and higher interest rates as investors shift more capital to equities. There are likely to be bumps along the way, but should outcomes improve global economic from currently positive trends, then investors are likely to experience significantly higher equity prices.