Ben getting a ton of questions on this so here are more explanations.
“Davidson” submits:
Here is a chart of the 4 quarter moving avg Real Private GDP. The BLACK DOTTED LINE is the trend line. This trend is based on quarterly data and a matching trend line i. calculated monthly in another spreadsheet to do the calculation for the Value Investor Index.
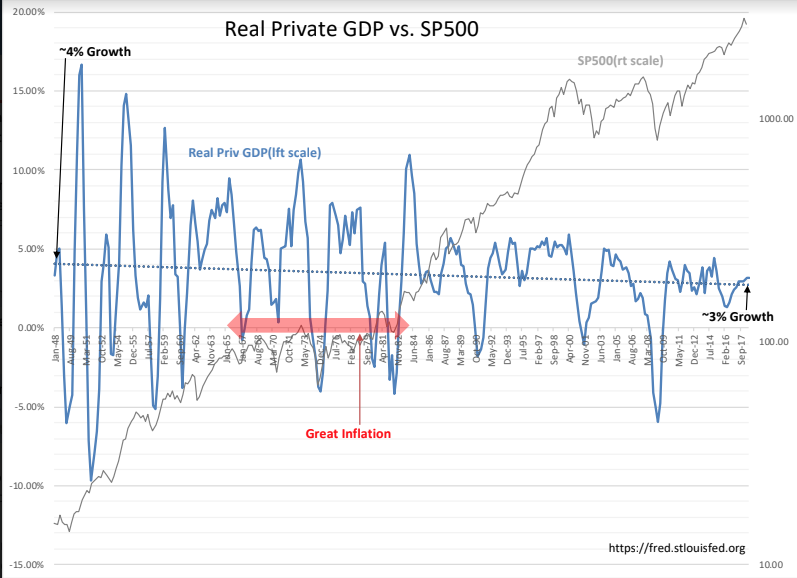
The spreadsheet with the data is at this link. I went with the Private GDP calc when it was clear that ’Sequestration’ had skewed GDP calculations lower causing most economists to declare the Obama Recovery the worst ever. Taking Govt Exp&Inv out of GDP revealed that the Private GDP reflected a normal recovery had actually occurred. There is no difference in Real GDP vs Real Private GDP long-term growth till ’Sequestration’ occurred.Net/net government spending has no long-term impact on economic growth even though many believe this to be true. It is the primary if not the sole source of inflation as government spending expands the amount of currency without adding productive assets to the economy. This is most notable during wars when goods and highly trained individuals are destroyed/killed in conflict. If one thinks of the capital lost in war without long term productive outcome in the face of borrowed funds not paid back, war being a source of inflation is obvious.The current administration has relied on foreign forces and economic pressure to counter bad-behavior. US has lost very few soldiers with the effort of countering ISIS. This has been non-inflationary even with added military spending. There is little correlation in the rise or fall in oil and inflation in the past 10yrs. It shows that commodity prices are the result of inflation fear and not a cause of inflation.The market has many myths that this data does not support. M2 growth a inflationary is one of these. It is not.