People still hang on the weekly rig count data as if it is falling it is a predictor of future production declines. Flatly stated, it isn’t. Take natural gas for instance. Below is a chart of natural gas production from 1970 to the present.
Now lets look at the natural gas rig count:
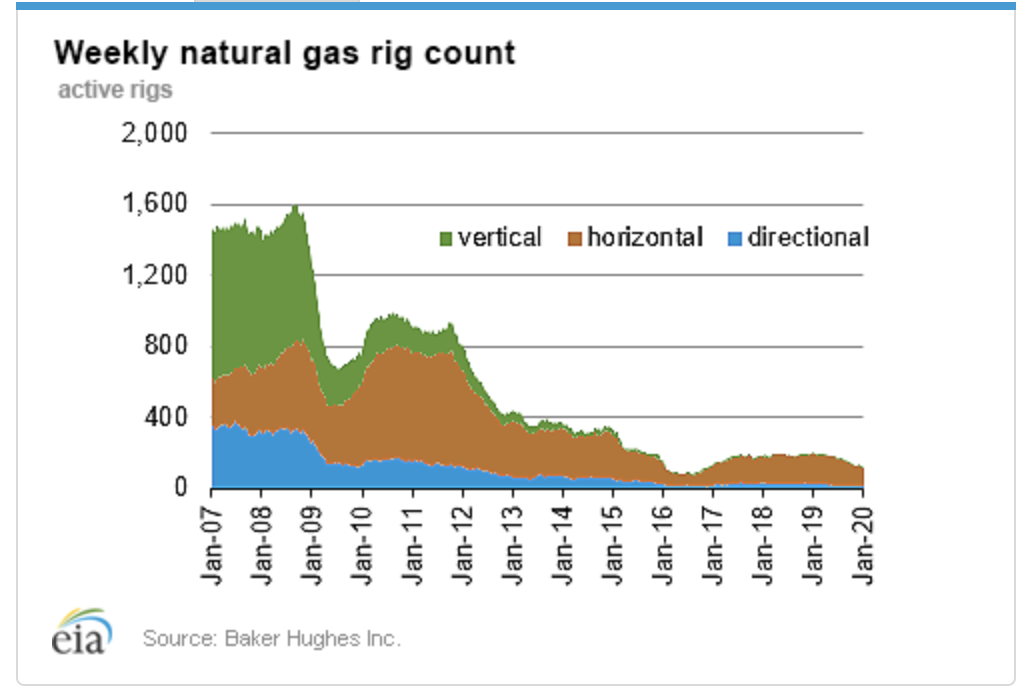
It is important to note 2008 was the all-time high for the number of rigs in the US. Currently, natural gas rig count of 120 is higher than the prior-week tally of 119. However, the count of rigs exploring the commodity is lower than the prior-year week’s 198. Per the latest report, the number of natural gas-directed rigs is 92.5% below the all-time high of 1,606 recorded in 2008.
92.5% below the all-time high and we are producing a record amount of natural gas.
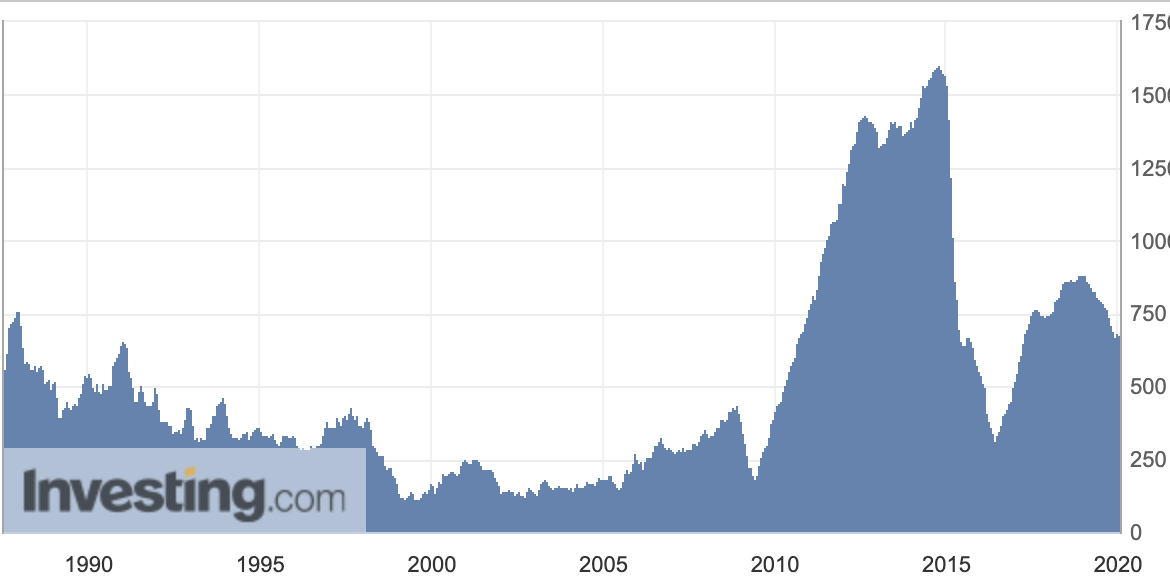
Let’s look at oil:
We are producing a record amount of oil (the chart is through Oct. 20129). As with natural gas, US oil rig count has fallen, off 60% from the all-time high in 2015 and basically equal to 1985 levels while production has risen 40% from 1985.
Technological advances mean we can and are producing much more of both commodities with fewer rigs. So, when we see incremental declines in the rig count data one should not extrapolate that to corresponding production declines. However, should the counts rise, it is pretty safe to say we will see production increases.
Where is the US rig count expanding the most? The Permian Basin in west Texas which now hold the largest number of rigs.
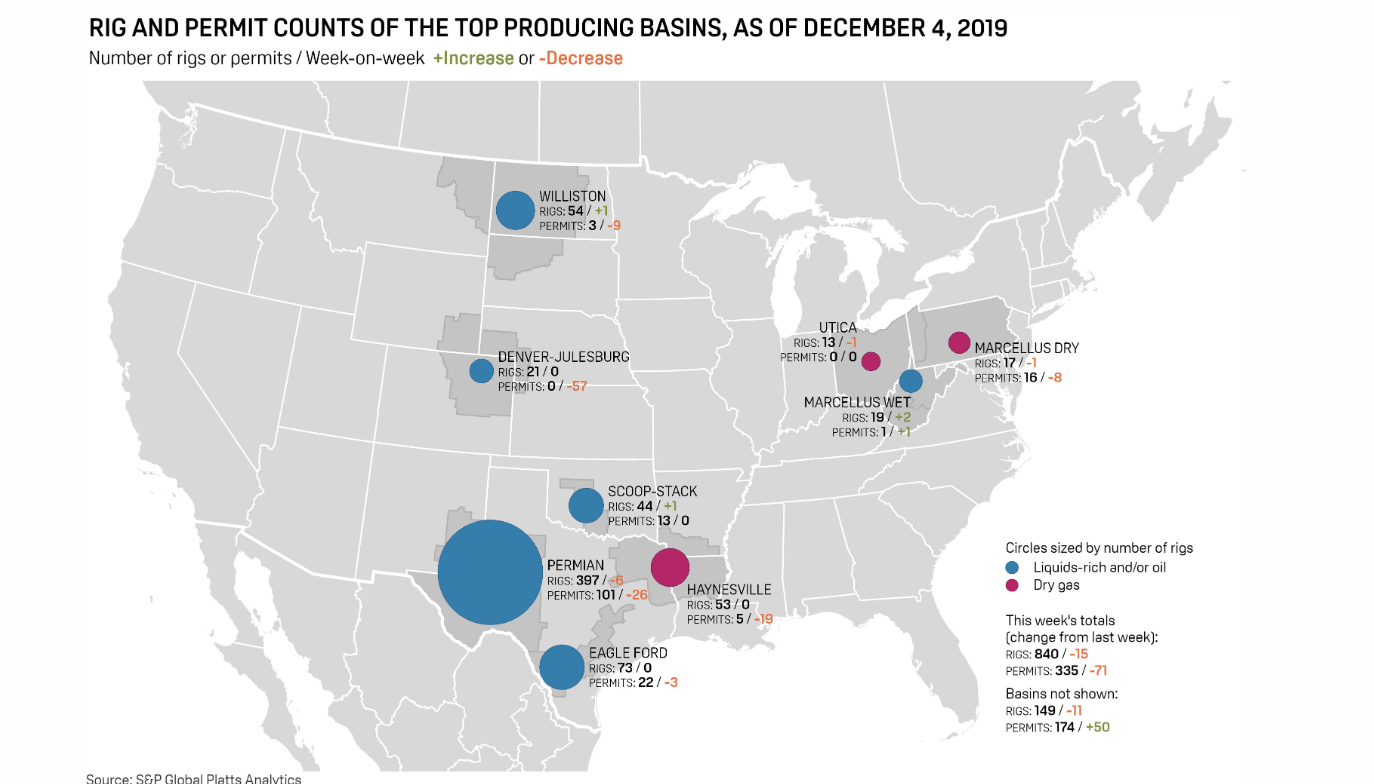
This is why I like TPL so much. they are the dominant landowner in the region and get royalties off all the oil and gas extracted from and transport through their land. Additionally they have a fast growing water business to supply and treat the much needed commodity to the frackers in the region.