“Davidson” submits:
In 4 charts:
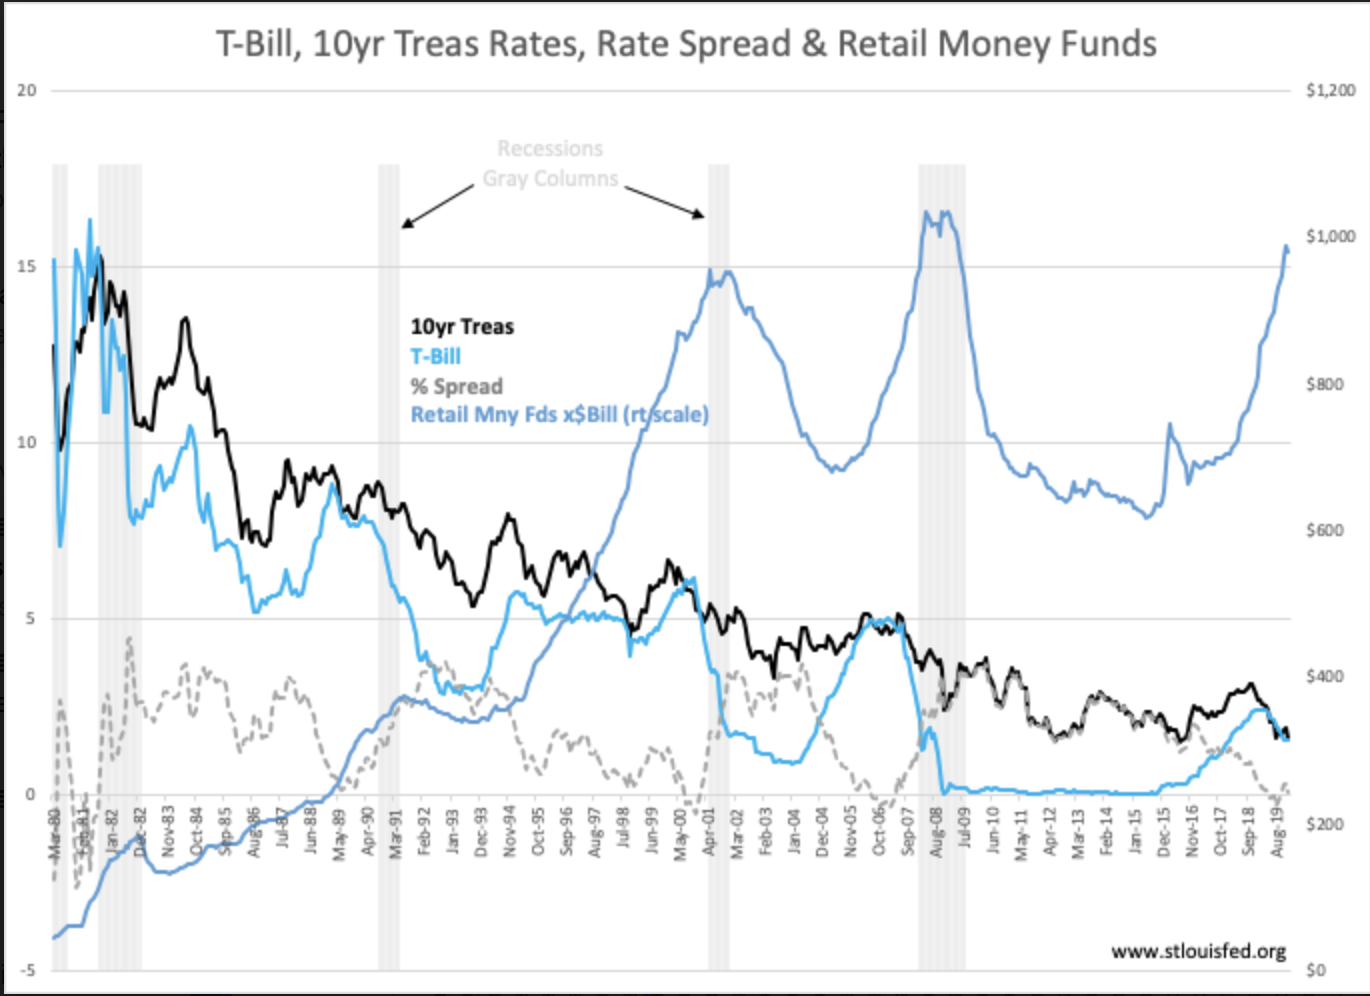
The 1st chart shows market prices in the form of % rates which have signaled every recession and a few false flags since 1953. The signal comes when the yield curve inverts, i.e. when the T-Bill rate exceeds the 10yr Treasury rate during a period of market speculation. The directionality of rates is the important condition. Every period of equity speculation has been fueled by capital shifting within the specific market from Fixed Income to Equities. When speculators reach a feverish pace, the capital leaving T-Bills drives their rates above that of the 10yr Treasury (which have also been rising) that so narrows Net Income Margins at banks and etc that they slow lending sharply. Capital shifts driving equity markets higher leading to a yield curve inversion has always been insensitive to business valuations which in turn leads to a high level equity speculation precisely at the point of economic correction. Defaults on existing debt which can no longer be rolled-over begin to rise. Lending slows ever more rapidly as defaults trigger a shift to tighter underwriting standards and economic activity slows rapidly leading to a recession. Such signals have become incorporated into today’s ubiquitous trading algorithms. That many take the narrowing of the T-Bill/10yr Treas rate spread as a negative economic signal is present in the soaring level of Retail Money Funds. Retail Money Funds now hold $1Trillion. Nearly as high as the bottom of the ‘Great Recession’ which followed the Sub-Prime Housing Crisis.
Algorithms are unthinking mathematical formulas. Many equate them with a form of AI (Artificial Intelligence) but they only take past relationships without conditional analysis. Apply conditional analysis to the current market and it is clear that recent yield curve inversion is the result of sharply falling 10yr Treasury rates. The fall in 10yr rates has come about with a rise in US$ (US Dollar) as foreign capital outside the US marketplace shifts into our markets for safety. The shift comes as US foreign policy seeks to rebalance global tariff regimes and curb threats to Democracy by No. Korea, China, Russia, Cuba, Venezuela, Turkey and others. The proof that this yield curve inversion does not signal economic slowing comes from fundamental economic indicators with a history on which investors can rely.
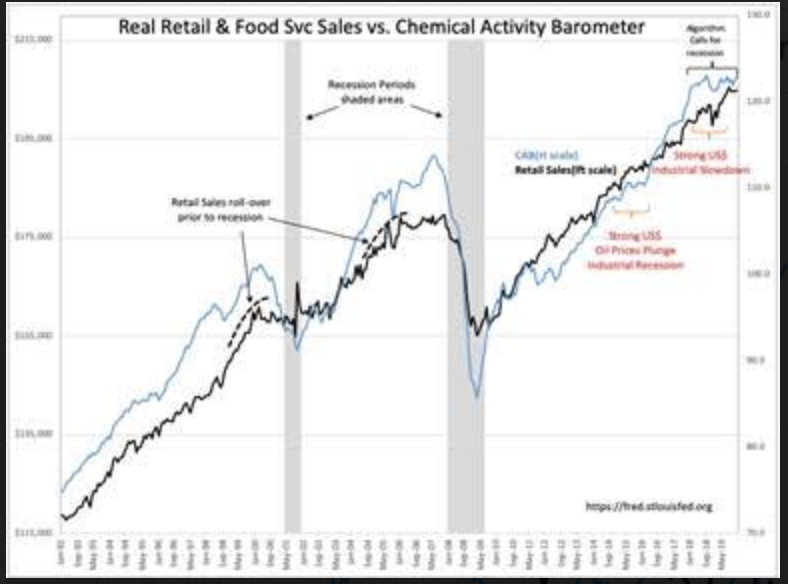
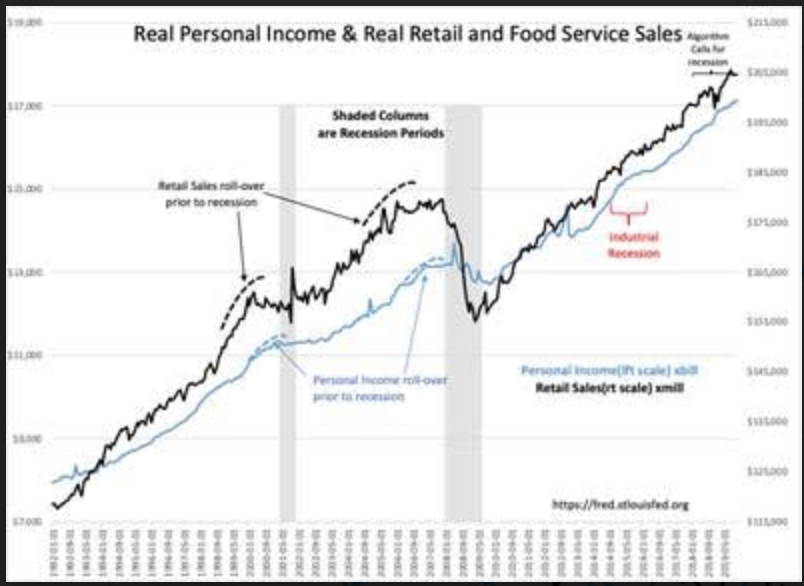
The next 3 charts represent economic indicators which in the past have clearly signaled economic slowdowns that do not indicate the same today. Basic to economic activity are Retail Sales, Personal Income, Employment, production and goods transport indicators. Shown are the Chemical Activity Barometer(CAB), the Trucking Tonnage Index(TTI), Job Openings, Retail and Food Service Sales in combinations which permit comparisons with one another. One can see that these indicators roll-over with slowing economic activity prior to recessions. The signals provided occur well before recessionary periods begin and even prior to equity market tops. There are no signs of economic slowing today despite the signals provided by interest rates and algorithmic trading.


Commodity prices including the US$ have also been part of algorithmic activity. Which price signal drives any particular algorithm at any point in time shifts depending on the headlines of the moment. For investors seeking logical signals, one must find them in the economic signals not price-trends. While price-trends can shift on-a-dime, positive one day and negative the next, economic trends shift slowly over 12mo-24mo and provide ample opportunity for investors to avoid the ravages of recession if one is looking.
The yield curve is about to invert once again as I write this. The rate spread was 0.07% today and pessimism again found strong expression in the media. The algorithms are signaling it’s time to panic while economic indicators signal a period of clear-sailing.
My advice is to trust the economic indicators. Add capital to portfolios and remain optimistic because so many are not!! The best values are Industrials and Energy Related issues. Avoid FAANG issues, TSLA, BIDU and most International markets. The US is on an economic expansion not seen since Pres Reagan cut regulations 40%+. They called it “The Miracle Economy”. We are on this track precisely because the current administration has reduced regulations 30%+ with more to follow.