This actually concerns me. I am of the opinion this is pure inventory restocking and will fall significantly once it is done.
“Davidson” submits:
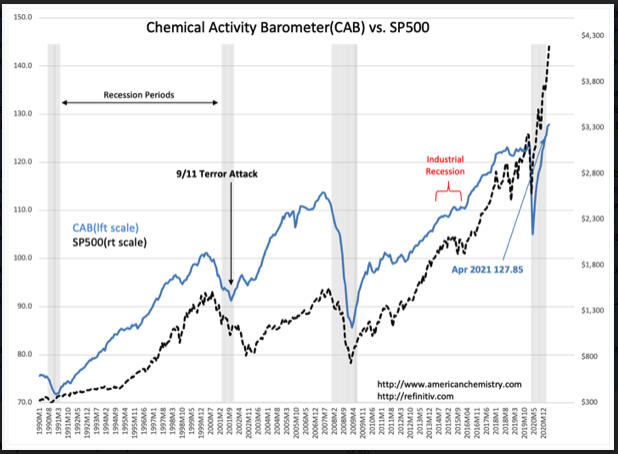
Chemical Activity Barometer(CAB) reports new all-time high. One should never rely on single indicators as the sole input for investment decisions, nonetheless, if one was restricted to selecting a single indicator out of thousands in use today, the CAB is the one I would choose. Its correlation with the SP500 is impressive even though the CAB is mostly fundamental while the SP500 is pure market psychology. The CAB is a composite indicator combining manufacturing output in the chemical industry, with hours worked, chemical prices, shipment information and some input of industry equity prices. The SP500 is pure pricing of equities based on investor’s perception of future with all that is known to that point in time, i.e. SP500 pricing is plainly and simply pure expectation. Where the SP500 pricing does not correlate with the CAB can be shown to have been investor misinterpretation in hindsight.
New highs for the CAB indicate ongoing economic expansion. Turns higher in the CAB coming out of recessions have a history of marking later NBER declarations of recession end-points. By this measure, the COVID-19 recession ended April 2020, 12mos ago, and the equity markets have risen while many continue to cry that recessionary forces require enormous government stimulus. Such increased liquidity only drives equity prices and other thematically traded securities higher. Market participants justify Bitcoin at $60,000+ even though no one truly knows or can explain how this provides value to promoting economic activity. It is what it is. Every investment cycle has its “Bitcoin” or its “Tulip Mania”.
Underlying much of current speculation, has been an influx to the US of foreign capital making the US$ the strongest currency globally. This is not new. There are signs that it began in the late 1990s with Modern Portfolio Theory directing capital to open up EmgMkts then believed to be growth opportunities. The net/net creation of new globally connected investors began a flow of capital to Western Markets, especially the US seeking safe havens for their capital. The initial outcome was to drive Sovereign Debt rates lower and real estate prices higher as preferred by these investors. That flow has only increased, in my opinion, with the rise of autocratic government globally. This creates in the US a class of very inexperienced investors with money to throw at any investment with an uptrend. In my opinion, we are seeing the beginnings of a 1980’s style “Japan Inc” over-priced market. How high investors will chase prices will only be registered once the next inverted yield curve occurs. Current conditions indicate this is likely 3yrs-5yrs in the future. This is a Momentum Market of historical proportion in my opinion.
My own guestimate for the SP500 has been gradually raised based on my perception of investors willingness to ignore fundamentals. It is actually not a willingness to ignore fundamentals but more that they are nearly without investment experience and believe prices do carry hidden signals which permit continuation of uptrends. My guess is we could see the SP500 priced $8,000+ in several years. US investors have a choice to participate and exit using tested indicators or to not invest at all and wait till a severe enough correction occurs such that one can justify reinvestment. With the current level of liquidity pouring into the US marketplace, there may not be such a correction along the way for investors to justify jumping in.
My recommendation is to remain invested with best managed companies one can identify. Remain invested till we approach the next yield curve inversion after a multi-year period of obvious speculation. The large institutions cannot afford to sit out a rising market no matter how over-valued. They will pressure prices higher along with other Momentum Investors till then.
The CAB is one of several trusted fundamental indicators coupled with the T-Bill/10yr Treasury rate spread.