“Davidson” submits:
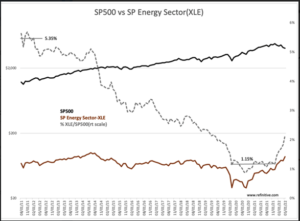
SP500 vs SP Energy Sector(XLE) is a simple price comparison. ETFs are designed to track prices of the underlying securities. The shares outstanding vary, dependent on the ebb and flow of capital in and out of the ETF. The simple price comparison reveals investors are in the early stages of raising commitments to E&P related companies after high pessimism shown March 2020 during the COVID-shutdown. The March 2020 low percentage was 0.88%. The current percentage is 2.14% having surged since Dec 2021 from 1.15% as investors have gradually exited COVID-favored issues for Reopening-favored issues. Media headlines have similarly evolved from suggesting that fossil issues be eliminated for society’s benefit to leaning towards this sector as vital for economic growth as alternative sources fail to meet expectations.
In 2012, XLE represented 5%+ of the SP500 when $WTI was at similar levels as today. Much has changed with society’s overall perceptions of the benefit of fossil fuels shifting to viewing them as the ultimate risk. The past 10yrs has witnessed gross divestment of carbon fuel-based companies from endowments and retirement portfolios and the development of societal benefit scores(ESG) geared to force what has been called our greatest ‘existential risk’ to our climate with rising temperatures melting glaciers and pole ice resulting in flooded cities, failed food sources and a host of other disasters. This perception is peppered with daily commentary of pointing to every disaster anywhere as further evidence. Is it?
The scientific evidence does not support CO2 as the boogeyman it is advertised. The National Oceanic and Atmospheric Administration(NOAA) has on its web site data which but for a few suppressed voices has been ignored by the media. The story of the past 20yrs is actually a non-story. The NOAA posts the historically scientifically-correct trend measurements of sea level and CO2 atmospheric concentrations. Sea levels have been recorded at The Battery(NYC Harbor) daily using a tide gauge since 1856. CO2 has been measured at the Mauna Loa Observatory(Hawaii) since 1958. Each has a trend that is clearly observable. CO2 measured in ppm(parts per million), has been estimated to have been, using multiple accepted scientific approaches to construct the historical record, in a range of 270ppm-290ppm for the last 1,000yrs. 1913 is the first time in recent history that it rose above 300ppm. It rose slowly to 312ppm in July 1958 when the Mauna Loa Observatory began its official record keeping and has since risen to ~415ppm or ~32% in 64yrs.
The interpretation is CO2 is likely rising as a result of the global increase in fossil fuel use. The scientific question in this age of quick to declare the ‘other person at fault’, “Is CO2 causal to the global temperature and sea level rise?” The scientific answer is simple but has been entirely lost it the headlines of disaster reporting and a pattern of societal ‘blame-game’. “It’s not me, it’s you!”. It has become an “I’m good, you’re bad!” and I am on the good side and personally virtuous. You are not! This is emotional-based reasoning not encompassing a logical assessment of the data. The data itself does not support this societal bifurcation. Bear with me on this. My background is heavy in science, PhD Physical Organic Chemistry with a ton of math and physics and data evaluation. I once worked as a research chemist at GE Plastics, 1979-1982, and have always listened to what the data indicates vs social themes. This note will not be outside anyone’s commonsense.
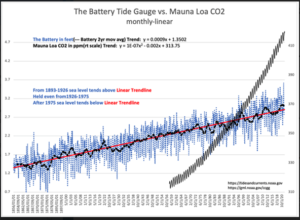
The data shown in The Battery Tide Gauge vs. Mauna Loa CO2 can only be interpreted one way. That is, there is no correlation between the trend in sea level and the trend in atmospheric CO2. A glance is all one needs to come to this conclusion. Visually it is obvious. The sea level trend is unchanged during the period CO2 has risen 30%+. To think though the relationship oft stated by those seeking funding for their research, one needs to work through the causal connections claimed linking sea level with CO2. CO2 is a greenhouse gas. This is true. Greenhouse operators actually pump CO2 into their growing facilities to accelerate plant growth. But, is it the structure that retains heat from sunlight or the CO2 which proponents of Global Warming claim is an existential threat. The earth is clearly in a warming period which it has been for the past 20,000yrs. Ice in glaciers and at the poles has melted https://en.wikipedia.org/wiki/Past_sea_level#/media/File:Post-Glacial_Sea_Level.png causing sea levels to rise 475 feet to date. The current pace in NYC is 2.9millimeters/year with 0.9mm from sea level changes and the rest from the fact that the land under NYC is subsiding ~2mm/yr. Every tide gauge reflects a mix of tectonic shifts and the gradual melting that has been occurring for 20,000yrs. The scientific question is “Has man’s use of fossil fuels which emit CO2 having an impact on this trend?” The short answer is “No!”
One can see this visually. To come to the conclusion that CO2 has no impact on sea level one needs to 1) trust what you see and 2) trust your own judgement. The sea level trend has no influence from the rise in CO2 otherwise there would be a very, very obvious visual rise in the sea level trend shortly after 1958 when the rise began in CO2. There is no added rise and therefore zero correlation. This means that CO2 is not causing global warming and an acceleration in global ice melt as claimed for more than 20yrs. The earliest pronouncements had sea level flooding the UN Building in NYC by 2009, a more than 14 foot rise. One needs to only deploy a modicum of logic to counter the ‘self-proclaimed experts’. No correlation period!
Mathematically, the trend in sea level is linear while that in CO2 is 2nd order polynomial. CO2 reflects global economic expansion and use of fossil fuels which has an exponential growth rate. This is to which the ‘x2’ term in the y = 1E-07x2-0.002x+313.75 is related. The term +313.75 is the trend-medium CO2 starting point in 1958. Note the -0.002x term. Something is diminishing the CO2 growth. My best guess is that this is the result of the earth visually greening the past 50yrs in satellite pictures. NOAA says this is so. Rising CO2 is likely accelerating global plant growth and extracting CO2 from the atmosphere. Comparing the CO2 trend to the sea level trend y = 0.0009x+1.3502, reveals this trend only has an ‘x’ term Sea level is a linear growth rate. Mathematically, we should see this trend adjust higher from 1958. That we do not proves there is not the correlation endlessly repeated in the media. This is scientifically rigorous. If you see it, you have just done a rigorous evaluation.
The implications for investing are beginning to reveal themselves in the sharp rise in XLE and media focus. Government policies have favored alternatives to fossil fuels for 20yrs+ with disparagement of this sector. Share prices have been forced lower for more than a decade and eliminated from major investment portfolios globally. The effort to be politically correct has funneled $Trillions into investments believed to fit this theme. Recent weather and geopolitical events have revealed the weaknesses of reliance on green energy solutions. Societies have been forced to return to despised fossil fuels for simple economic survival. It is economic reality and survival in a politically unstable world that bring everyone’s commonsense to the fore. This is what we are seeing in the revival of investor interest as reflected in the XLE. In my opinion, society is gradually coming to terms with a massive misperception of CO2.
Investors, in my opinion, should have fossil fuel related issues as component of portfolios. I visualize not only XLE coming fully back in favor, but likely going to excess as investor perception and price-momentum becomes apparent with Momentum Investors. US markets in particular witnessed a pooling of global capital as global investors became more aware of threats of autocratic governments elsewhere. Much of this capital, is in my opinion, directed by inexperienced investors who rely on price-trends to make decisions i.e., they are Momentum Investors. Markets are in correction today as these investors exit the COVID-favored companies having priced many at incredible valuations, 50x+ Revenue. Outrageous levels of valuation! Many have interpreted the resulting price declines as recessionary signals when economic indicators do not support this conclusion. Underlying economic indicators reveal a post-COVID expansion that is continuing despite corrections in some which COVID had driven well out of historical trends. Normalization continues as government policies drive inflation and energy prices. It becomes less confusing when one’s focus is on data and economic fundamentals and not driven emotionally by the shifting sands in headlines.
In my analysis E&P companies and related industries have a substantial recovery ahead as perceptions shift. Oil stocks are likely to become the next Momentum Issues.