The SPR will be ~70% depleted at this rate in another 12-18months
“Davidson” submits:
- Total US Crude Inventories decline ~6mil BBL(working inv rises 2.5mil and SPR falls 8.5mil) US Crude Prod unchanged at 12.1mil BBL/Day, Crude Imports declined 1.1mil BBL/Day(~7.5mil BBL/Week) Fudge factor 0.792mil BBL/Day(5.54mil BBL/Week)
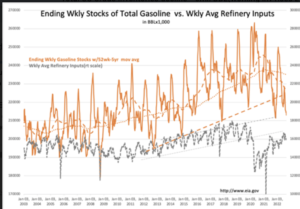
- Inventories of Refined Prod stable with a slight rise in Exports
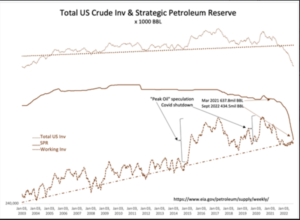
The Working Crude Inv trend was added to the Total US Crude… chart. While SPR remains in steep decline, the Working Crude Inv has stabilized at the trend line from 2003-Present. Note the periods of surplus working crude. The first instance occurred after a period of intense price speculation ending in 2014 and likely the result of traders being forced to accept and store physical crude on contracts that proved uneconomic. The second instance was 2020 when the economy was locked down during COVID. Both saw eventual work-down to the trend line. US Working Crude Inv continues to track the trend line.
The patterns suggest E&P sector has extracted working capital by lowering inventories to a point that now appears stable. The SPR continues to be drawn down by ~1mil BBL/Day. Expectations that this drawdown will end in Oct relies upon administration guidance that may change. Some are betting on a rise in prices. I would not count on it.