“Davidson” submits:
It is a given that pessimism is high. It is at historic levels for some measures. The media covers the many issues daily.
- Retail Sales are reported as “tumbling”.
- Job Openings are collapsing.
- Layoffs are soaring.
- PMI collapsing
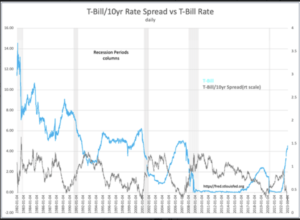
- The yield curve, the T-Bill/10y Treasury rate spread, has inverted to a historical level.
- Money funds are at record levels.
- Etc, etc, etc
It is given that certain assumptions are believed to be true. In fact, these assumptions do not hold up to closer scrutiny.
- Consumer spending causes inflation
- Oil demand causes inflation
- Oil prices are a measure of economic activity as is “Dr. Copper”
- The Fed controls interest rates
- A rising US$ is negative for the US economy
- The Fed/the government can fix economic problems
- Entrepreneurialism can be taught
- Economics follow mathematical models
- The economy follows market sentiment
What is problematic about much of the commentary today is that it is not supported by rising employment and personal income data reported recently. In the effort to trade ahead of the crowd and to control portfolio outcomes, the largest pools of capital have been forced to implement algorithms i.e., mathematical models based on past market patterns. The issue is that while some market patterns broadly repeat, the essence of markets is that each is unique. Every cycle catches investors relying on past patterns by surprise precisely because it is believed markets repeat with some mathematical relationship when attention to history shows that what investors believed in past cycles never repeats. Investors do cycle from pessimism to optimism every cycle. But, every cycle has an investor focus that is unique as every cycle carries unique innovations, unique geopolitical issues and unique and always unique government solutions which hindsight proves incorrect. The one truism which holds is that share prices and investor behavior do repeat even though the context is unique. The one element we can count on is that high pessimism is reflected in stock prices and other indicators with which investors can use to gauge market lows.
The single truism that has held for every market cycle in history:
Market Lows = High Pessimism = Investment Opportunity = Long-term Investment Performance in Buying Better Companies at Discounted Prices
One has to learn these things to sort out the opportunities that are present in every market. Five charts help to sort through much of the current context. The role of the investor is to sort out where various measures differ from past market cycles and identify within high pessimism where lay investment opportunities.
- Chart 1-Real Retail & Food Svc Sales vs. Job Openings, Quits & TempHelps
- Chart 2-T-Bill/10yr Rate Spread vs T-Bill Rate
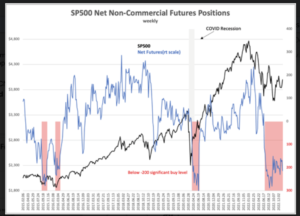
- Chart 3-SP500 Net Non-Commercial Futures Positions with SP500 prices
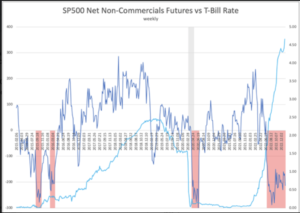
- Chart 4- SP500 Net Non-Commercial Futures Positions vs T-Bill Rate
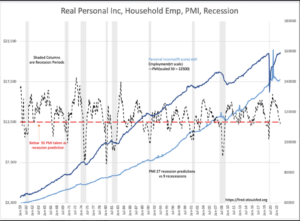
- Chart 5- Real Personal Income, Household Employment, PMI, Recessions
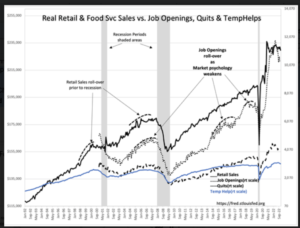
The first step in the sorting process is to understand that the consensus conflates sentiment measures with hard data economic measures as if they carry equal value for investment insight. The second step is to place all in context of investment history especially events of last few years rather than assume a single month’s report is an indication of a future trend. A decline in Retail Sales or Job Openings from recent extraordinary highs should be interpreted more as normalization than as deteriorating economics. The same holds for Quits and TenpHelps. The consensus has been taught to trust mathematical trends and act on deviations from these trends since the 1950s with the introduction of Modern Portfolio Theory(MPT). This methodology dominates consensus thinking with an effort to avoid making judgement errors. The greatest error is, in my opinion, in assuming MPT is error free when the numbers on which it is based are from underlying conditions which do not repeat. Those who teach and deploy MPT and associated algorithms have long lost the historical perspective of continued human innovation and striving which makes the basis for MPT unrepeatable. The reliance on MPT has led to investment strategies incorrect for the current market.
Sorting sentiment indicators from economic indicators relies on recession periods for which is every investor wants to predict ahead of time to avoid the downward spiral in market prices at cycle’s end while taking advantage of the upward spiral that comes with the next cycle. All five charts display recession periods(Gray Columns). The only longer-term correlations with recessions occur with employment indicators, retail sales and personal income. Each of these is a count i.e, hard data, of an aspect of economic activity. On the other hand. stock prices, the PMI, and the net non-commercial futures positions correlate with each other and with views expressed in media headlines. These are sentiment indicators which have no place in investment analysis as economic measures The PMI(Dashed Black Line) predicts 3-times as many recessions vs. what occurred, i.e., 27 recession signals vs 9 recessions. It is when sentiment severely disagrees with economics that investment opportunity is created. Interest rates have also correlate with recessions. The yield curve inversion is notorious for having been predictive but, if its true basis is understood, something else is occurring today.
Inversion of the yield curve defined as the T-Bill higher than the 10yr Treasury rate is shown in Chart 2, the GRAY LINE. Why it has worked to predict recessions can be understood if it is thought of as a measure investor speculation. When investors commit enough T-Bill capital to investments forcing T-Bills to invert the 10yr, it represents excess speculation. Investor panic at realizing they have over-extended is represented by collapsing T-Bill rates. The TORQUISE LINE is the T-Bill rate which is seen to fall in every period of market pessimism as investors sought the safe-haven of short dated Treasuries. It should be clear that today’s very pessimistic consensus has resulted in T-Bill rates spiking, not declining. This begs the question ”What is the consensus thinking?” The answer lays in the news headlines and what the consensus is recommending, namely rather than shift to T-Bills and driving these rates lower, the decision has been made this time around to buy 5yr-10yr Treasuries which is believed will benefit from falling rates as everyone else responds to recession. This shift to longer dated Treasuries drives T-Bill rates higher. It looks like ‘speculative hedging’. This hedging has become self-reinforcing for those using algorithms which rely on yield curve inversion signals without consideration of core economics. The voices pointing out how much the yield curve is inverted by some advisors has become shrill.
That many believe in imminent market collapse is reflected in the various sentiment indicators near record lows. The Bank of America Fund Manager Survey confirmed this week that equity allocations are reported as the lowest since 2005. History provides a clear measure that markets have already priced in investors’ worst fears.
The current environment remains a good buying opportunity in my opinion. My guess that today’s prices represent the lowest prices we are likely to witness for the next 5yrs.
One last observation which came out of Davos this morning that reflects the critical thinking that has been so lacking in the current market. This is simply another reason why investment opportunities are present elsewhere from consensus view. Jamie Dimon is a critical thinker.
Jamie Dimon on CNBC interview at Davos 1-19-2023
“Bitcoin is hyped up fraud”