“Davidson” submits:
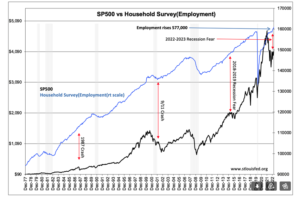
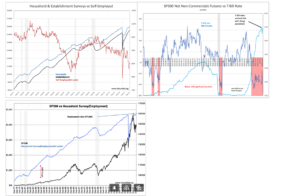
SP500 Net Non-Commercial Futures established a new weekly record for the length of time it has averaged (negative) -200 with last week’s number of -321.5, more than 9 months of intense pessimism by this market psychology indicator. At the same time, the Household Survey and Establishment Survey Employment reports posted new post-COVID highs. Never has such a juxtaposition occurred. The SP500 has always strongly correlated with rising employment, SP500 vs Household Survey, but not this time, The past 9mos has been duel of those investorswho rely on economic signals vs those who rely on market prices. A rising employment trend has always correlated with rising equity markets (SP500) but not this time. The questions of the day are:
- “What is going on?”
- “How will this resolve?”
Excerpts from the most recent report:
“Total nonfarm payroll employment rose by 236,000 in March, and the unemployment rate changed little at 3.5 percent, the U.S. Bureau of Labor Statistics reported today. Employment continued to trend up in leisure and hospitality, government, professional and business services, and health care.”
“Household Survey Data: Both the unemployment rate, at 3.5 percent, and the number of unemployed persons, at 5.8 million, changed little in March. These measures have shown little net movement since early 2022.”
The 1st question has its answer in the actions of T-Bill vs Net Non-Commercial Futures and in the comparison of Household Survey vs SP500. The current dominance of algorithmic trading on market prices can be seen in in the 3-week action of T-Bill rates vs Futures. In recent weeks SVB Financial failed then FDIC stepped in to quell the fear of total banking collapse and traders briefly removed some bearish bets. A few days later this was replaced by the collapse of Credit Suisse and bets for market collapse snapped back. Computerized trading, using algorithms reliant on price signals, rely on an age-old perception into one of the most one-sided market positioning strategies ever witnessed. There is a 7-decade history of yield curve inversion that has signaled recession and significant market correction This has become the dominate trade in hedge fund positions. They short short-maturity Treasuries(T-Bills, 1yr and 2yr equivalents) and buy long longer dated maturities. The belief is that an equity market collapse will produce significant returns as rates fall. Problematic in this thinking is that markets respond to fundamentals and over the longer-term ignore the temporary pessimism of investors. The net/net is that pessimism has never scared the economy into recession if the fundamentals supported growth. And that is the answer to the 2nd question. Higher equity lay ahead.
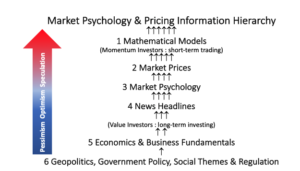
Market Psychology & Pricing Information Hierarchy is a schematic representation of how markets work. All market prices represent investor psychology. As investor psychology shifts second to second, prices follow. This is true for every security, asset class and derivatives from equity through fixed income, currency and commodity markets. While fundamentals and government policies are the eventual drivers of prices, by the time they emerge from levels 6 & 5 to eventually influencing pricing, there are a slew of added nuances from investor biases. Investors using algorithms operate with information at levels levels 2 & 1. They ignoring fundamentals. The positive economic trends have been temporarily lost in a morass of pessimism.
Fundamentals always win. Eventually it is fundamentals that force investors to follow. Once convinced that their prior positioning was incorrect, the consensus buys into the economic trend. Unfortunately, algorithmic investors, also called Momentum Investors, always overdo following the trend to their detriment. With employment rising, a fundamental indicator, this is one of those periods when investor perception is opposite to economic reality.
Most investors have shorter perspectives and need to be reminded of past instances where fundamentals like employment eventually emerged as the driver of equity prices. Those periods were added to the SP500 vs Employment chart.
The disparity today is the greatest we have experienced in the past by my analysis.