“Davidson” submits:
With the SP500 over $4,400 and many now speaking of a “new Bull Market” all that has occurred is a relief of the extreme pessimism of recent months when the SP500 Net Non-Commercial Futures Positions reached -434.2 the week ending June 2nd. The July 7th level remained below the -200 benchmark at -207.2, still registering an overly pessimistic level of sentiment. The first chart’s arrows identify lows in the SP500 which precede collapses in optimism. Likewise, a rise in the SP500 also reveal a lag in the swing towards a more optimist market psychology even with declarations of a “Bull Market”. Already some are declaring a market peak is at hand with the recent easing of extreme pessimism making this a market call based on relative positioning rather than having to do with anything based on fundamentals. The newly minted marketing focus, “The Magnificent 7”, that represents 25% of the SP500’s and nearly 50% of the NASDAQ’s relative capitalizations, ignores the other 493 of SP500 and 3,000+ of NASDAQ members that represent the US economy. For those with a historical view, every over-simplification of specific recommendations of issues to include in every portfolio has always proven a top for these issues. Apple(AAPL) holds that ‘must-own’ position today.
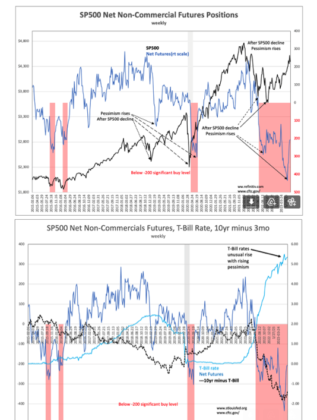
The second chart compares the SP500 Net Non-Commercial Futures with the T-Bill Rate and the historical inverted yield curve measure, the 10yr minus 3mo Treasury rate benchmark. T-Bill rates remain at an unusual level of 5.36% with the 10yr minus 3mo yet at -1.40% even though better than the record -1.89% of June 1st. The T-Bill rate has historically always been at its low during periods of intense pessimism but the last 18mos reflects an unusual market hedge, shorting T-Bills to buy 5yr-10yr Treasuries to take advantage from an expected market collapse. In my opinion, this has confused many who rely on the 10yr minus 3mo signal into believing a historic collapse was imminent not recognizing that this time this inversion signal is manipulated and not a signal that should be followed. The fundamentals reveal a far more positive narrative.

The leader of the fundamental indicators is employment. Noted in the history from Dec 1977, a nearly 56yr record, are multiple instances when there were market declines not reflected in declines of employment levels. Eventually, the employment trend and the economic output that followed pulled equities higher as investors were forced to accept a reality not they had not perceived. The day-to-day focus on single events that can topple markets, a trader’s mentality, historically entirely misses the comparatively molasses pace of economics that does not enter headlines till enough firms’ quarterly reports forms a critical tipping point that finally catches enough investor attention to become the equity-driving factor. This is not an off- vs. an on-event. It is recognition that emerges softly. It is a market psychological shift characterized by one investor at a time turning more positive. It is truly a snail’s pace till it suddenly isn’t.
Last week’s employment reports continued employment’s uptrend, a fundamental measure most have feared to date. At some point (a point I thought would be recognized much sooner than it has thus far been) up trending employment will suddenly be recognized as a positive and a signal the vast array of ignored equities deserve higher pricing.